Graphic coordinate transformation #
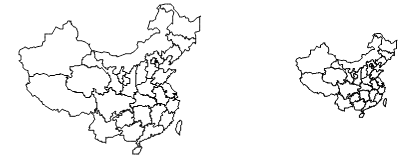
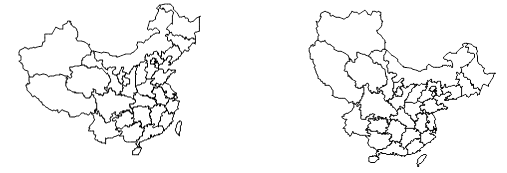
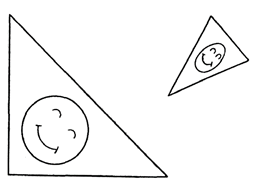
After the map is inputted, projection transformation is often needed to get the map in longitude and latitude reference frame. The main reason for coordinate transformation of various projections is that the map is a projection at the time of input, and the output map product is another projection. There are two ways of projection transformation, one is to use polynomial fitting, similar to image geometry correction; the other is to use projection transformation formula directly to transform. In the process of projection transformation, there are three basic operations: translation, rotation and zooming. 1)Translation Translation is to move a part or the whole of the graph to another position in the Cartesian coordinate system (Fig. 61-1-a),the transformation formula is as follows: X’=X+T:sub:`x` Y’=Y+T:sub:`y` 2)Zoom Scaling operations can be used to output graphics of different sizes (Fig. 6-11-b), the formula is as follows: X’=XS:sub:`x` Y’=YS:sub:`y` 3)Rotation In map projection transformation, it is often necessary to apply a rotation operation (Fig. 61-1-c), to achieve a rotation operation, a trigonometric function is used, assuming a clockwise rotation angle of θ, the formula is: X’=Xcosθ+Ysinθ Y’=-Xsinθ+Ycosθ Translation Zoom Graphic rotation Graphic coordinate transformation If the translation, rotation and scaling of graphics are considered comprehensively, the coordinate transformation formulas are as follows: The upper formula is an orthogonal transformation, and its more general form is: The latter is called two-dimensional affine transformation (Affine Transformation), the affine transformation can have different compression and expansion in different directions, which can transform the sphere into an ellipsoid and turn the square into a parallelogram (Figure 6-12). Fig. 77 Affine transformation # Basic coordinate transformation #
Affine tranformation #
Graphic mosaic #
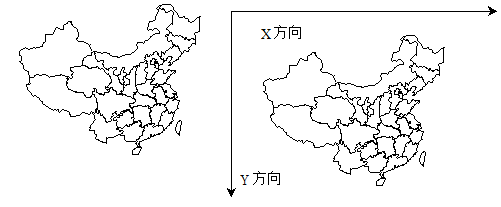
After digitizing the base map, it is difficult to complete the base map of the study area in a whole form due to the relatively large frame size or the use of a small digitizer, this requires dividing the entire frame into several parts for input. When all the parts are input and spliced, there are often inconsistencies in the boundary, and edge matching processing is required (Figure 6-13). Edge matching processing, similar to the suspension node processing mentioned below, can be done automatically by a computer, or assisted by manual semi-automatic completion.
In addition to the reason of map size, in the practical application of GIS, because of the frequent input of standard scale topographic maps, splicing processing is also needed after input, at this time, projection transformation is generally needed first, the usual method is to transform the Gauss-Kruger projection used in topographic maps into longitude and latitude coordinate system, and then to splice. Fig. 78 Map sheet mosaicking. Before mosaicking; edge mismatches during mosaicking; adjusted mosaicking result # 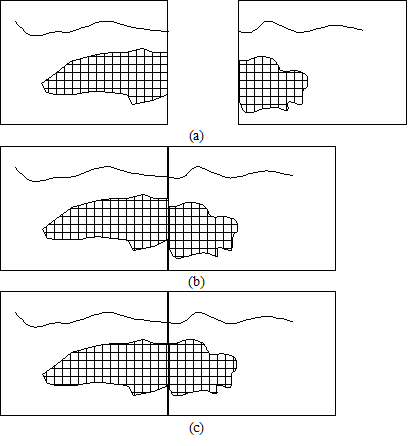
Topology generation #
After the digitization of graphics, whether hand tracking digitization or scanning vectorization, it is necessary to establish a topology for most maps in order to correctly distinguish the topological relationship between objects. In GIS data management, topological relationships can be defined as follows:
1) Area : In the DIME data model for polygon data, each polygon can be represented by a set of closed lines without recording all points on the boundary. This avoids duplicate recording of shared edges between adjacent polygons, thereby reducing data redundancy.
2) Adjacency :, another attribute that can be described by topology is the mutual adjacency between polygons.
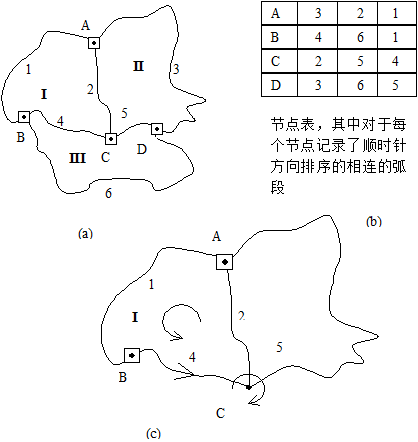
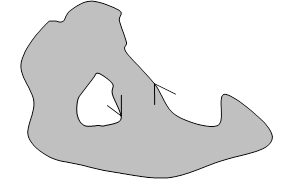
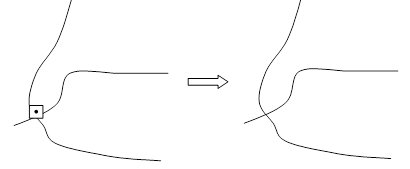
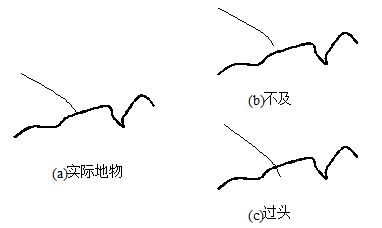
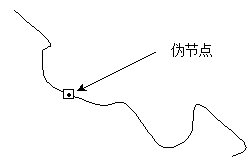
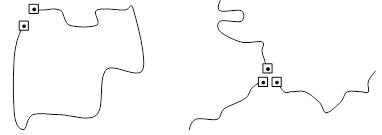
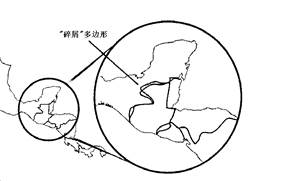
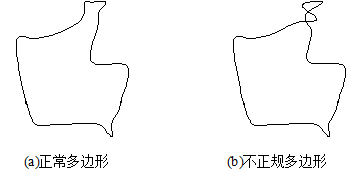
3) Connectivity , connectivity refers to the discriminating of arc connections, the establishment and performance of connectivity is the basis of network analysis. In the process of establishing the topological relationship, some errors in the process of digital input need to be corrected, otherwise, the established topological relationship will not correctly reflect the relationship between objects. ESRI defines the following six criteria for judging whether the input graph is correct or not, which can help to detect topological errors. All input entities can be represented; No additional entities are entered; All entities are in the right position, and their shapes and sizes are correct; All connected entities are connected; All polygons have and only one marker to identify them. All entities are within boundaries. The above criteria, especially Articles 5 and 6, are only for ESRI’s ARC/INFO software, and other GIS software may vary depending on the implementation. Due to the digitization of maps, especially the digitization of hand-held tracking, it is a time-consuming and cumbersome manpower, the mistakes in the digitization process are almost inevitable, the specific reasons for digitization errors include: Missing certain entities; Due to the two-dimensional distribution of map information and the typically large volume of data, it is difficult to accurately track which entities have been entered and which have not. This often leads to duplicate entries and omissions. Inaccurate positioning, digitizer resolution can cause positioning error, but the human factor is the main reason for inaccurate position, such as hand shake during hand-held tracking digitization, and the movement of drawings between two entries can make Inaccurate location; more importantly, it is difficult to achieve completely accurate positioning during the digitization of hand-held tracking, for example, in the entry of water system (Fig. 6-14), it is basically impossible to record the end point of the tributary just on the main stream (Figure 6). -14-a), more commonly the two cases shown in Figures (b) and (c). Fig. 79 Digitization Errors – Undershoots and Overshoots # On digitized maps, the specific manifestations of errors are as follows: 1) Pseudo Node , the pseudo-node makes a complete line into two segments (Figure 15), the reason for the pseudo-node is often that one line has not been entered at one time. Fig. 80 Pseudo-nodes # 2) Dangling Node , if a node is connected to only one line, it is referred to as a dangling node. Dangling nodes can occur in several scenarios, such as an unclosed polygon (Figure 6-16-a), undershoots or overshoots (Figure 6-14-b, Figure 6-14-c), and non-coincident nodes (Figure 6-16-b). Polygons are not closed; nodes do not coincide Fig. 81 Two scenarios of dangling nodes # 3) Debris polygon or sliver polygon The strip polygon (Fig. 6-17) is generally caused by repeated entry, because the position of the same line is not exactly the same twice before and after, resulting in a “debris” polygon. In addition, “debris” polygons may also be generated due to data updates with maps of different scales. Fig. 82 Debris polygon # 4) Weird Polygon Weird Polygon (Fig. 6-18) are caused by the inversion of the order or inaccurate position of points on the input line. In the process of topology generation, the “debris” polygon will also be generated. Fig. 83 Irregular polygon # The above errors are generally found during the process of establishing the topology and need to be edited and modified. Some errors, such as danglingNode, can be automatically modified by the software at the same time of editing, the usual implementation method is to set a “capture distance”, when the distance between nodes or between nodes and lines is less than this value, it is automatically connection; After the graphics are modified, it means that the correct topological relationship can be established, the topological relationship can be automatically generated by the computer, at present, most GIS software also provides complete topology functions; however, in some cases, you need to manually modify the topology relationships created by the computer, a typical example is network connectivity. As described in the definition of the topology, when establishing a topological relationship, only the connections and adjacent relationships between the entities need to be concerned, and the non-topological attributes such as the position of the node and the specific shape of the arc do not affect the establishment process of the topology. 1) Establishment of topological relations of polygons If DIME or similar encoding models are used, the expression of polygon topological relationships needs to describe the relationships between the following entities: Composition arc of polygon; Polygons on the left and right sides of the arc segment and nodes at both ends of the arc segment; The arc connected by nodes. In fact, the process of establishing polygon topology is to determine the above relationship. Specific topology building process is related to data structure, but its basic principle is consistent, the following is a brief description of the process of polygon topology building (Figure 6-19). There are four nodes in Figure 6-19, which are represented by A, B, C and D, six arcs which are represented by numbers, and three polygons of I, II and III (Fig. 6-19-a). First, the following concepts are defined: Since the arc segment is directional, the starting node of the arc segment A is called the head node N :sub:`s` (A) , and the terminating node is the tail node * N E (A)* ; Considering the directionality of the arc, along the direction of the arc, the adjacent polygons are defined as left and right polygons P :sub:`L` (A) and P : Sub:`R` (A) . Before building the topology, first set the left and right polygons of all the arcs (in the implementation, you can use the coding of the polygon) to be empty; then calculate the angle at the junction of the connected arcs for each node and sort them (Figure 6-19-b) (note that this sort is circular). The algorithm for establishing a topology is as follows: Get the first arc A and set it to the current arc; Determine if P :sub:`L` (A) and P :sub:`R` (A) is empty. If it is not empty, go to the first step, when all the arcs have been processed, the algorithm ends; If the left polygon is empty, create a new polygon P , the first arc of the polygon is the current arc, and set P :sub:`L` (A)= P , set the search start node to N :sub:`s` (A) and search for the current node as N :sub:`E` (A) . If the right polygon is empty, create a new polygon P , the first arc of the polygon is the current arc, and set P :sub:`R` (A)=P , set the search start node N :sub:`0` =N :sub:`E` (A) , search for the current node N :sub:`C` =N :sub:`S` (A) . Determine if N :sub:`0` and N :sub:`C` are equal. If yes, all arcs of the polygon have been found, go to the first step. Check the sequence of arcs that have been aligned with the current node, and use the next arc of the current arc segment A’ as the second arc of the polygon. If N :sub:`C` = N :sub:`S` (A’) , set P :sub:`L` (A’) = P , N :sub:`C` = N :sub:`E` (A) ; if N :sub:`C` = N :sub:`E` (A’) , set P :sub:`R (A’) = P*, N :sub:`C` = N :sub:`S` (A) , and proceed to Step 4. As shown in Figure 6-19-c, if you search from arc 4 and find node C, the next arc is 2 according to the order of the arc; then find node A, arc 1, and the whole search ends. Polygon I, which has an arc of 4, 2, and 1. According to this algorithm, the arcs that generate polygons are arranged counterclockwise from the inside of the polygon. If the node arcs are sorted clockwise, the algorithm uses P :sub:`L` (A) instead of P :sub:`R` (A) , with * P R (A)* instead of P :sub:`L` (A) , the generated polygon arcs are arranged clockwise. Fig. 84 The process of establishing a polygon topology # To establish the polygon topology, pay attention to the case of the polygon “island”, according to the above algorithm, for a polygon with an “island”, or a ring, the arc segment contains a plurality of closed curves, and the arc of the “island” The segment ordering is clockwise (Figure 6-20) (actually, it is still counterclockwise from the inside of the ring polygon). Fig. 85 Results of a topology with polygons with “islands”. # 2) Establishment of network topology relations When inputting information such as roads, water systems, pipe networks, and communication lines, it is necessary to determine the connection relationship between line entities in order to perform traffic and connectivity analysis. The establishment of the network topology relationship includes determining the relationship between the node and the connection line, this work can be done automatically by the computer, but in some cases, such as road traffic applications, some roads intersect on the plane but are not actually connected, as an overpass, which requires manual modification, removes connected nodes (Figure 6-21). Fig. 86 Editing of nodes to delete nodes formed by actual disconnected lines # Graph modification #
Establishing topological relations #