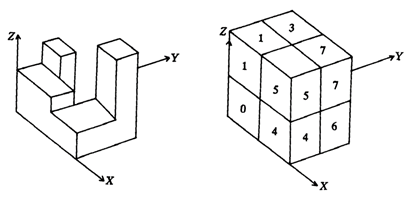
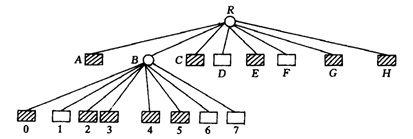
At present, with the rapid development of computer technology and the gradual improvement of computer graphics theory, as a new frontier subject, GIS is becoming more and more mature, and many commercialized GIS software functions are becoming more and more perfect. However, the vast majority of commercial GIS software packages only simulate and deal with the phenomena and problems encountered in the real world on the basis of two-dimensional plane. When dealing with three-dimensional problems, they often feel inadequate. The data dealt with by GIS related to the earth, i.e. the spatial data commonly referred to, are essentially three-dimensional continuous distribution. Natural phenomena related to geology, geophysics, meteorology, hydrology, mining, groundwater, disasters, pollution and so on are three-dimensional. When scientists in these fields try to describe them by two-dimensional system, they cannot accurately reflect, analyze or display relevant information. The requirement of three-dimensional GIS is similar to that of two-dimensional GIS, but it is much more complicated than two-dimensional GIS in data acquisition, system maintenance and interface design. At present, the research contents and functions of three-dimensional GIS mainly include: Data coding: It is a tool for collecting three-dimensional data and checking its validity. The validity checking will vary with the natural attributes, representation methods and accuracy level of data. Organization and Reconstruction of Data: This includes the topological description of three-dimensional data and the transformation from one representation to another (e.g. from the boundary representation of vectors to the octree representation of rasters). Transform: It can transform not only all objects or some kind of objects, but also some objects, such as translation, rotation, tailoring, scaling and so on. In addition, we can decompose an object into several and combine several objects into one. Inquiry : This function depends on the intrinsic properties of a single object (such as position, shape, composition) and the relationship between different objects (such as connection, intersection, shape similarity or composition similarity). Logical operations :Objects are combined by AND, OR, NON and XOR operators. Calculation : Calculate the volume, surface area, center, distance and intersection of objects. Analysis : Such as calculating the distribution trend of a certain type of terrain, or other indicators, and comparing the models. Modeling . Visual transformation : At any point of view selected by the user, all objects or some specified objects are represented by user-defined perspectives, scaling factors and symbols. System Maintenance : Including automatic backup of data, security measures, and network work management. Like two-dimensional data structure, three-dimensional data structure has two forms: raster and vector. Grid structure uses spatial indexing system, which includes dividing the three-dimensional space of geographical entities into small units, called voxels or voxels. The simplest way to store this data is to use three-dimensional run-length encoding, which is an extension of two-dimensional run-length encoding in three-dimensional space. This encoding method may require a lot of storage space. The more complex technology is octree, which is an extension of two-dimensional quadtree. Three-dimensional vector data structure representation has many methods, among which three-dimensional boundary representation and octree representation with topological relationship are most commonly used. Using octree to represent three-dimensional shape can be regarded as a generalization of quadtree method in three-dimensional space or an improvement of three-dimensional voxel array method. The logical structure of the octree is as follows: Assuming that the object V to be represented can be placed in a sufficiently large cube C, the edge length of C is the n-th power of 2, and the object VC, its octree can be defined by the following recursive method: each node of the octree corresponds to a subcube of C, and the root of the tree corresponds to C itself. If V = C, then the octree of V has only the root, if V is not equal to C. Then C is divided into eight sub-cubes, each of which corresponds to a sub-node of the tree root. As long as a sub-cube is not completely blank or occupied by V, it will be divided into eight equal parts, and the corresponding node will have eight sub-nodes. Such recursive judgment and segmentation are carried out until the corresponding cube of the node is completely blank or occupied by V, or its size is predefined voxel size, and a certain “rounding” between the voxel and V is made so that voxels are either considered blank or V occupied. Nodes on the octree can be classified into three categories: Grey Node, the corresponding cube is partially occupied by V; White Node, the corresponding cube has no V content; Black nodes, the corresponding cubes are all occupied by V. The latter two types are also called leaf nodes. Because the structure of octree is very similar to that of quadtree, the storage structure of octree can follow the quadtree method. According to different storage methods, octree can also be called regular, linear, one-to-eight octree and so on. Rule octree The storage structure of the octree is to represent each node in the tree with a record of nine fields, one of which describes the characteristics of the node, and the other eight segments are used as pointers to its eight sub-nodes. This is the most common storage structure used to represent tree data. There are many defects in regular octree. The biggest problem is that pointers occupy a lot of space. Therefore, although this method is very natural and easy to master, it is not ideal in the utilization of storage space. Linear octree Linear octree pays attention to how to improve space utilization. It traverses the octree in a predetermined order and converts the octree into a consistent linear table. Each element of the table corresponds to a node. Linear octree not only saves storage space, but also is more convenient for some operations. But the cost is a loss of flexibility, as shown in Figures 3-18 and 3-19. Fig. 44 Three-dimensional data in voxel form # Fig. 45 Linear octree coding of Figure 3-18 # A one-to-eight octree A non-leaf node has eight child nodes, which are marked as 0, 1, 2, 3, 4, 5, 6, 7 for determination. As can be seen from the introduction above, if a record corresponds to a node, the eigenvalues of the eight sub-nodes of the node are described in the record. The pointer gives the storage place of the records corresponding to the eight sub-nodes, and implicitly assumes the storage order of the records of these sub-nodes. That is to say, even if a record is unnecessary, the corresponding storage location must be free there to ensure that records of other peer nodes are not mistakenly accessed. Of course, there will be some waste, unless it is a complete octree, that is, all leaf nodes appear at the same level, and the nodes in all layers above that level are non-nodes. In order to overcome this shortcoming, one is to increase the computational load, that is, before accessing the corresponding node records, first check its parent node records, look at the previous several leaf nodes, so as to know how to access the required node records. The storage requirement of this method is undoubtedly the smallest, but it needs to increase the amount of calculation; the other is to add some information to the record, so that the calculation work can be appropriately reduced or more convenient. For example, three bytes are added to the original record, one is divided into eight, and each sub-node corresponds to three, representing the offset of its sub-node in the pointer pointing area. Therefore, in order to find the record location of its sub-nodes, it is necessary to multiply the position pointed by the pointer with the offset value (0-7) by the number of bytes occupied by the record, so that the description of a node is recorded as follows: Deviation Pointer SWB SWT NWB NWT SEB SET NEB NET The octree obtained in this way is the same as before, except that there are three bytes more before each record. Three-dimensional display usually uses cross-section, equidistant plane, multi-layer plane and three-dimensional block diagram and other forms. Most of the three-dimensional display technology is limited to the two-dimensional form of CRT screen and drawing paper. People can observe the three-dimensional shape of geographical phenomena, but they can not be analyzed as discrete entities, such as three-dimensional can not be measured, stretched, changed shape or combined. With the help of three-dimensional display technology, contour maps, cross-sectional maps, multi-layer planes and perspective maps can be formed by discrete elevation points, which can be completed manually at first, and quickly and efficiently by various computer programs. Figure 3-20 shows a representation of three-dimensional data. Fig. 46 Representing three-dimensional data through “fence” diagrams # Functions of three-dimensional GIS #
Three-dimensional data structure #
Octree three-dimensional data structure #


Display of three-dimensional data #
