The essence of map symbols #
Concept #
Symbol is the language of map, and it is the basic means to express the content of map. Map symbols are composed of graphics and characters with different shapes, sizes and colors, notes are an important part of map symbols, which also have different shapes, sizes and colors. As far as a single symbol is concerned, it can represent the spatial location, size, quality and quantitative characteristics of things; as far as a similar symbol is concerned, it can reflect the distribution characteristics of various elements; and the sum of all kinds of symbols can indicate the interrelationship between the elements and the overall characteristics of the region.
Map symbols can indicate the target type (e.g. highway) and its quantitative and qualitative characteristics (e.g. pavement type and width of highway driving part), and can determine the spatial location of objects and the distribution of phenomena (e.g. population density).
Classification #
1) Classification by symbol location
Symbols can be divided into positioning symbols and explanatory symbols.
Location symbols refer to the symbols which have definite positions on the map and can not be moved arbitrarily, such as rivers, residential areas and boundaries. Most of the symbols on the map belong to this category.
Explanatory symbols refer to a kind of additional symbols for describing the quality and quantity characteristics of things, which usually exist on the basis of positioning symbols, such as symbols for describing forest species. They are located within the boundaries of the earth on the map, but they have no positioning significance.
2) Classification according to the distribution of objective things represented by symbols
Symbols can be divided into face symbols, dot symbols and line symbols.
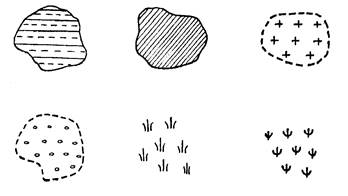
Face symbols are symbols that can represent the distribution of things on a map scale. Planar symbols are used to represent the distribution range of things by contours (solid lines, dotted lines or dotted lines), their shapes are similar to the plane figures of things. Colors or descriptive symbols are added to the contours to represent their properties and quantities, and their lengths, widths and areas can be measured from maps. Generally, such symbols are also called proportional symbols (Fig.). Fig. 166 Face symbol # 
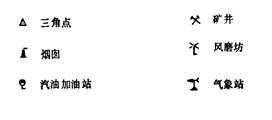
Point symbols are symbols used to express small areas (such as oil depots) and points (such as control points) that cannot be expressed on a scale. The shape and color of dot symbols represent the nature of things. The size of dot symbols usually reflects the level or quantitative characteristics of things. However, the size of dot symbols has nothing to do with the scale of maps. It only has positioning significance. It is also called scale-independent symbols (Fig.). Fig. 167 Symbolic method # 
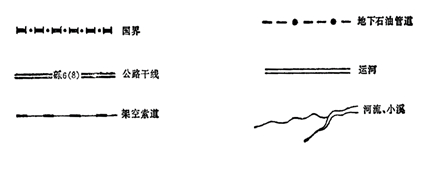
Linear symbols are symbols that express things extending in line or band. For example, rivers, the length of which can be expressed in scale, but the width of which can not be expressed in scale, need to be exaggerated appropriately. Therefore, the shape and color of Linear symbols represent the quality characteristics of things, and their width often reflects the level or value of things. Such symbols can represent the distribution, extension and length of things, but can not express their width. They are also commonly called semi-proportional symbols (Fig.). Fig. 168 Linear symbol # 
Composition characteristics of map symbols #
Component elements of symbols #
The shape, size and color on the map are the three basic elements of symbols.
1) Symbol shape
The shape of symbols mainly represents the shape and characteristics of things, the shape of face symbols is determined by the plane figure of things it represents, the shape of point symbols is often related to the external characteristics of things, the shape of line symbols is various forms of lines, such as single line and double line.
2) Symbol size
Symbol size is related to map content, use, scale, visual resolution, drawing and printing ability, different scale maps have different symbol size.
3) Color of symbols
The color of the symbol can enhance the concept of classification and classification of each feature of the map, simplify the shape difference of the symbol, reduce the number of symbols, and improve the expressiveness of the map. The use of color is mainly used to reflect the quality characteristics, quantity characteristics and grades of things.
Systematization of map symbols #
Map symbols consisting of changes in shape, size and color are not isolated, they are intrinsically linked. Through the change of symbols, the classification, classification, importance and minor of map contents can be expressed.
The feeling effect of map symbols #
Maps are composed of symbolic figures in different positions, the complex arrangement of symbols can cause different visual feelings. When reading pictures, we can get different feeling effects such as holism, difference and stereo sense. The sense of holism is mainly formed by the absence of obvious differences between symbols; the sense of difference is formed by the distinct differences between different elements in the graphics; the sense of three-dimensional is mainly realized by changing the size and brightness of symbols through perspective, such as halo shading, which simulates the intensity of light on the surface of the ground, and shows it in different shades, which shows that the terrain undulates and produces a three-dimensional sense.
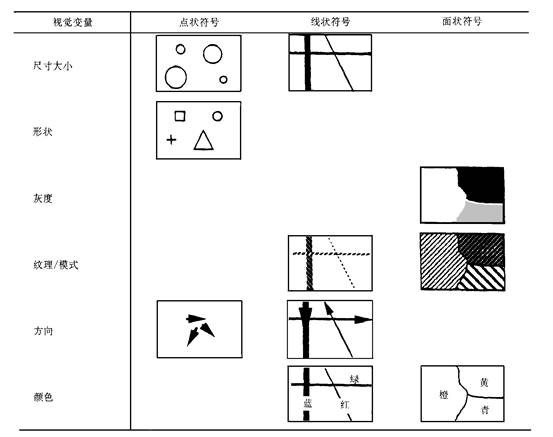
Map symbols use different visual variables, such as size, shape, gray level, texture, direction and color, to achieve different perception effects. (Figures) Fig. 169 Figure 11-4: Map symbol effect # 
Notes on maps #
Types of map notes #
Texts and numbers on maps are called map annotations, they are important parts of map content. Notes are not a natural element, but they are related to the elements represented on the map. Maps without notes can only express the spatial concept of things, but can not express the name of things and some quality and quantitative characteristics. The annotations on maps can be divided into name annotation, description annotation and digital annotation.
1) Name annotation Describes the distinguished name of various things, such as the name of a settlement;
2) Description note Used to describe the type, nature or characteristics of various things, supplement the deficiencies of graphical symbols, it is often indicated by a short note;
3) Digital annotation Used to describe the quantitative characteristics of certain things, such as elevation.
Note fonts, font levels and colors #
Different fonts are often used to represent different things on maps, such as Song style, isoline style, imitation Song style and horizontal line style, the size of annotations on maps is based on the specifications of photo typesetters, on a map, according to the importance and significance of things, different font levels are used to make the size of annotations correspond to the color of graphic symbols only. The change of phase and the choice of color should be related to the category of things indicated by the notes.
Arrangement and configuration of notes #
There are many annotations on maps, they can be located in any part of the map, but the proper arrangement and configuration of annotations often affect the effect of reading maps. Chinese character annotations usually include horizontal, vertical, goose-shaped (the direction of the annotated character points to the north or above the map outline) and buckling (the direction of the annotated character is vertical or parallel to the center line of the annotated character) and so on. The basic principle of note placement is that the important part of the note capping chart should not be made. Notes should have a clear relationship with what they say. For dotted objects, annotations should be arranged horizontally at any suitable position in the four directions of the dotted symbols; for linear objects, annotations should be arranged from left to right or from top to bottom along the extension direction of the linear symbols, with uniform word spacing, especially long linear objects, and the name annotations can be repeated; for surface objects, annotations should be arranged horizontally. Generally, it is placed in the face symbols and arranged along the direction of the maximum extension of the face symbols, the spacing of words is uniform and consistent.
Figure shows the different configurations of point, line and surface annotations. Fig. 170 Several possible annotation configurations # 
In order to determine the location of the feature annotation, the spatial relationship is judged, therefore, the GIS can provide automatic annotation for the map drawing, a system that implements automatic annotation placement has the following functions:
Determine the elements on the map and the corresponding notes;
Search and implement spatial data;
Generate experimental annotations;
Choose a better annotation position.
Because annotations are only descriptions of objects, they can not cover up objects on maps and overlap with each other, so GIS can also be used to judge whether or not annotations overlap. When annotating, it is impossible to annotate all the objects because of the load on the map, which needs to be selected, the usual selection method is to select the relatively important objects, which can also be achieved by ranking the attributes of the objects.