Inter-transformation between DEM models
In practice, DEM models can be converted to each other. Most DEM data are regular grid DEM, but it is not easy to store because of the large amount of data in regular grid DEM, or it may be necessary to use TIN model DEM for some analysis and calculation, such as visual analysis. At this time, we need to convert grid DEM to TIN model DEM. Conversely, if there is DEM data of TIN model, it is necessary to convert it into regular grid DEM in order to meet the needs of some application.
TIN generation from irregular point Sets
The most common method for converting this set of points into a TIN is the Delaunay triangulation metho, the key to generating TIN is the algorithm of Delaunay triangulation, the following is a brief description of the Delaunay triangulation and its even Voronoi diagram.
Voronoi graph, also known as Tyson polygon or Dirichlet graph, consists of a group of continuous polygons whose boundaries are composed of vertical bisectors connecting the line segments of two adjacent points. According to the nearest neighbor principle, N points are divided into two planes: each point is associated with its nearest neighbor region. Delaunay triangle is a triangle which is connected by the relevant points sharing one edge with the adjacent Voronoi polygon. The center of the circumferential circle of the Delaunay triangle is a vertex of the Voronoi polygon associated with the triangle. Delaunay triangle is a bipartite graph of Voronoi graph, as shown in Figure.
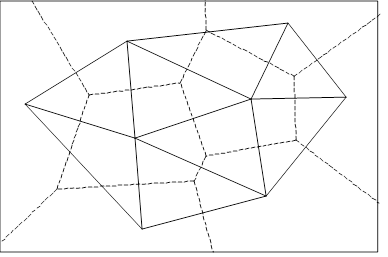
For a given initial point set P, there are many ways of triangulation, and Delaunay triangulation has the following characteristics:
Its Delaunay triangulation network is unique;
The outer boundary of the triangular network constitutes the convex polygon “shell” of point set P.
There is no point inside the circumferential circle of a triangle. On the contrary, if a triangle network satisfies this condition, it is a Delaunay triangle network.
If the minimum angle of each triangle in the triangle network is arranged in ascending order, the value of Delaunay triangle network is the largest, in this sense, Delaunay triangle network is the triangle network closest to regularization.
Following is a brief introduction to the basic criteria for the generation of Delaunay triangles:
The most concise form of the Delaunay triangle generation criterion is that the interior of a circumcircle of any Delaunay triangle cannot contain any other points [Delaunay 1934]. Lawson [1972] proposed the principle of maximizing the minimum angle: the diagonal of the convex quadrilateral formed by two adjacent triangles, after the mutual exchange, the minimum angle of the six internal angles no longer increases. Lawson [1977] proposed a local optimization procedure LOP (Local Optimization Procedure). As shown in Figure 9-7. First find the triangle containing the circumcircle of the new insertion point p, which is called the Influence Triangulation. Delete the common edge of the affected triangle (thick line in Figure b), connect pto the vertices of all affected triangles, and complete the insertion of the ppoint in the original Delaunay triangle.
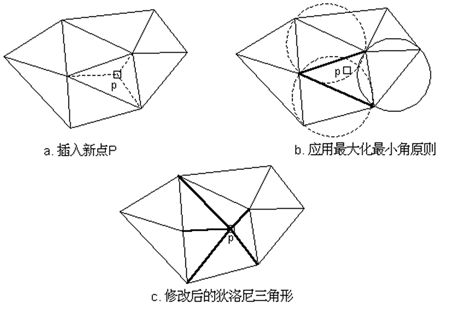
The Delaunay triangulation method is the most commonly used method to transform the point set into TIN, the generation process is completed in two steps:
Delaunay triangulation is generated by using the plane coordinates of P-neutral point set.
Give the elevation value to the nodes in Delaunay triangle.
Grid DEM to TIN
The conversion of grid DEM to TIN can be regarded as a special case of TIN generated by regularly distributed sampling points, its purpose is to minimize the number of TIN vertices, while retaining as much topographic information as possible, such as peaks, ridges, valleys and abrupt slope changes. The regular grid DEM can simply generate a fine regular triangulation, and many algorithms for it, most algorithms have two important features:
Screening the grid points to be retained or discarded;
Judging the conditions for stopping screening.
Two representative algorithms are the important point preservation method and the heuristic discarding method.
Retain important points
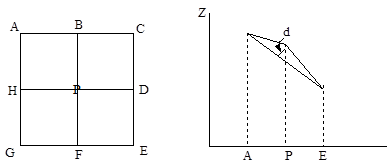
This method is a method of constructing TINs by retaining important points in the regular grid DEM [Chen, Gauvara (1987)]. It compares the importance of computing grid points and preserves important grid points. The important point (VIP, Very Important Point) is determined by the template of 3*3, which is determined whether the center of the template is an important point according to the elevation value of the eight neighbors. The importance of a grid point is compared by its elevation value to the interpolated value of the 8 neighbor elevations, and the grid points where the difference exceeds a certain threshold remain. The retained points are used as triangle mesh vertices to generate Delaunay triangulation, as shown in Figure, the elevation values of the center point P and the 8 neighbor points are obtained from the template of 3*3, and the distance from the center point P to the straight lines AE, CG, BF, and DH is calculated. The average of 4 distances, if the average value exceeds the threshold, P point is an important point, then it is retained, otherwise P point is removed.
Heuristic Discarding Method (DH-Drop Heuristic)
This method treats the selection of important points as an optimization problem. Given a grid DEM and the number of nodes in the transformed TIN, the algorithm seeks the best fit between the TIN and the regular grid DEM. Firstly, the whole grid DEM is input and calculated iteratively. Gradually, the less important points are deleted, and the processing process is completed until the quantity limitation or certain accuracy are satisfied. The specific process is as follows (Fig.):
The input of the algorithm is TIN, each time a node is removed for iteration, the TIN with fewer and fewer nodes is obtained. Obviously, the grid DEM can be used as input. At this time, all grid points can be regarded as TIN nodes, the method is to connect two relative nodes of four nodes in the grid, thus dividing each grid into two triangles.
Take a node O of TIN and other adjacent nodes. As shown in Figure 9-9, O’s adjacent points (called Delaunay adjacent points) are A, B, C, D. Delaunay triangulation algorithm is used to reconstruct O’s adjacent points, the real line in Figure 9-9 is shown.
Determine which of the newly generated Delaunay triangles the node O is located, as shown in Figure 9-9 as a triangle BCE. The elevation difference d of the elevation of the O point and the intersection O of the O point and the triangle BCE is calculated. If the elevation difference d is greater than the threshold de, then the O point is an important point and is reserved, otherwise, it can be deleted. deis the threshold.
Repeat the above judgment process for all nodes in TIN.
Until all nodes in TIN satisfy condition
d > d_eEnd.
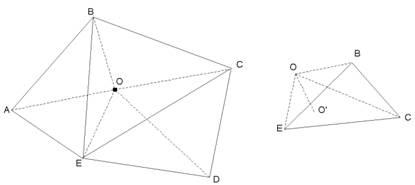
(The dotted line in the left picture is Delaunay triangle centered on O and the solid line is Delaunay triangle newly generated;
The picture on the right shows the calculation of the height difference [Note: This figure describes the three-dimensional space])
Comparing the two methods [Lee, 1991], the VIP method is best for retaining key grid points (vertices, pits); the DH method ensures the least information loss every time the data points are discarded, but requires a large amount of computation. Each method has its own advantages and disadvantages, in practical applications, different methods can be selected according to different needs, such as detecting extreme points, efficient storage, and minimum error.
Conversion of contour to grid DEM
The most common line pattern for representing terrain is a series of contours describing elevation curves. Because most of the existing maps have contours, these maps are ready-made data sources of digital elevation models, after scanning paper contour maps, DEM data can be automatically obtained. Because digitized contour lines are not suitable for terrain analysis such as slope calculation or making terrain rendering maps, it is necessary to convert digitized contour lines into grid elevation matrices.
Using local interpolation algorithms, such as distance-reduced weighted average or Kriging interpolation algorithm , can convert digital contour data into regular grid DEM data, but the results of interpolation often appear to be somewhat unsatisfied result, and the more careful the digital contour is, the more sampling points, the more serious the problem. The problem does not lie in the theoretical hypothesis of calculating interpolation weight coefficients, nor in the hypothesis that smooth contours are the reflection of real terrain, but in the estimation of the elevation of unknown grid points, the data of known points falling in a radius range should be searched, and then the weighted average of them should be calculated. If the searched points all have the same elevation, then the elevation of the point to be interpolated is also the same as the elevation value. As a result, the same elevation as the contour line is present in the narrow area around each contour line, and a “staircase” terrain appears. When the contours of the low-altitude plains are farther apart, the possibility of searching for data on a contour line is greater, and the problem is more serious, based on the DEM with “staircase” terrain, the calculation of the slope often results in an unnatural stripe pattern (Figure).
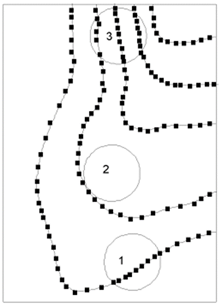
Fig. 107 Causes of “stair terrain” caused by contour interpolation
The best solution is to use a dedicated method for contour interpolation. If there is no suitable method, it is best to minimize the contour data points and increase the data points that identify peaks, ridges, valleys, and slope changes, while using a larger search window.
Extraction of contours by grid DEM
When using grid DEM to generate contours, it is necessary to treat each point as a geometric point rather than a rectangular area, so that contours can be tracked according to the quadrilateral formed by four adjacent points in grid DEM. The method is similar to that described later in extracting contours using TIN. In fact, each rectangle can be divided into two triangles, and the TIN algorithm is applied to extract contours. However, because there are two methods to divide the rectangle into triangles, in some cases, different contours will be generated (Figure), which needs to be judged and decided according to the surrounding situation.
(a) (b)
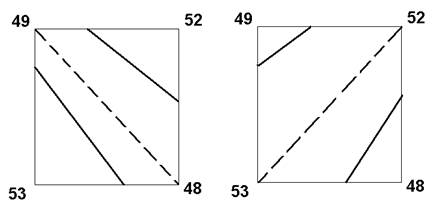
Fig. 108 Different contours are generated due to different triangulation
In extracting contours from grid DEM, besides dividing them into triangles, quadrilateral can also be used directly to track contours. However, in the case shown in Figure 9-11, the ambiguity of contour tracking still exists, that is, for each quadrilateral, there are two contour departure edges. The method of judging the choice is generally to calculate the distance, the connection mode of close distance is better than that of far distance. In Figure 9-11, the tracking method shown in Figure (b) should be adopted.
Another noticeable problem in extracting contours from grid DEM is that if the value of some grid points is exactly equal to the value of the contours to be extracted, the judgment process will become complicated and unclosed contours will be generated, the general solution is to increase the value of these grid points by a small offset.
TIN to Grid DEM
The conversion of TIN to grid DEM can be seen as a process of generating irregular grid DEMs from ordinary irregular points. The method is to generate a regular grid according to the required resolution size and direction, search for the nearest TIN data point for each grid, and calculate the grid point elevation according to a linear or nonlinear interpolation function.