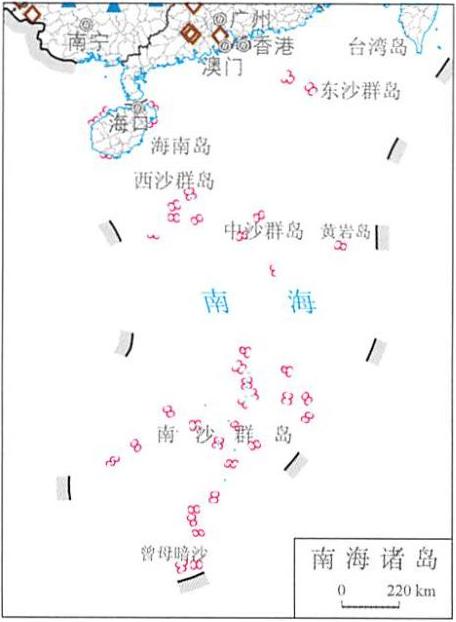
Online map of China's April disaster distribution in 2014
Category: China Nature Disaster
Map description
Map source
The online map of China's April disaster distribution in 2014 is from the Atlas of natural disasters in China in 2014, the book is edited by the National Disaster Reduction Commission Office, the Disaster relief Department of the Ministry of Civil Affairs, the National Disaster Reduction Center of Ministry of Civil Affairs, and is published by China Map Publishing House. The scale of this map is 1:22000000.
Online map of China's April disaster distribution in 2014

Connect to the map above.
Disaster assessment in April:
1.Northwest encounters strong winds to cool down and sandy weather, and drought develops in northeast and southwest
In April, Northwest China suffered from low temperature freezing, snow disaster and hail disaster, and the local loss was heavy. Among them, on April 22-26, the northwestern region encountered strong winds and sand and dust weather. The maximum wind was 10-12, and the temperature generally reached 8℃. Among them, the temperature in Urumqi, Xinjiang Uygur Autonomous Region dropped by 26℃ within 24 hours, the minimum visibility is less than 20 meters due to the extremely strong sandstorm in Dunhuang City, Gansu Province. Shaanxi, Gansu, Qinghai, Ningxia, Xinjiang and other five provinces (autonomous regions) were affected. In some areas, cotton, corn, wheat and other crops were damaged, and agricultural facilities such as greenhouses were damaged. Many trains were suspended for shelter, and many primary and secondary schools in Xinjiang were suspended. In April, the precipitation in Northeast China was 40% to 80% less than that of the same period in normal years, and the temperature was generally 2-4°C higher, which caused the rapid development of drought and affected the plowing. Since the middle of April, the drought in central and Western Yunnan and Western Sichuan has been developing, and agricultural production has been affected.
2.Wind and hail occurred intensively in the south of China, and the disaster of Honggang was lighter
In April, strong convective weather such as thunderstorms, gales and hail occurred successively in various southern provinces of my country. Affected by this, 9 provinces (autonomous regions and municipalities) including Guangxi, Chongqing, Sichuan and Guizhou were hit by the disaster, and 10 people were killed and missing. In April, large-scale rainy weather occurred in the south, with precipitation days generally ranging from 10 to 15 days, causing floods and other disasters, causing disasters in 7 provinces (autonomous regions and municipalities) including Jiangxi, Guangxi, Chongqing, and Sichuan, and 2 people were killed and missing.
3.Heavy local impact of the earthquake, and light casualties of geological disasters
In April, two earthquakes of magnitude 5 or more occurred in my country's mainland. Among them, the magnitude 5.3 earthquake in Yongshan County, Yunnan Province on April 5, caused 5 people to be seriously injured, 27 people were slightly injured, tens of thousands of houses were damaged to varying degrees, many schools were damaged to varying degrees, and many roads were blocked. On April 30, a magnitude 5.1 earthquake occurred in Hami City, Xinjiang Uygur Autonomous Region, causing certain losses to the local area and arousing social concern. In April, affected by rainfall, many geological disasters such as mountain collapses and landslides occurred in Shanxi, Guizhou, Yunnan and other provinces, causing casualties. In addition, disasters such as landslides occurred in the Ganli section and Chongqing section of the Lanhai Expressway, which caused some road sections to be closed and affected traffic.
Various disasters:
The yellow circle in the figure indicates: Drought disaster.
The blue triangle in the figure indicates: Floods and geological disasters.
The brown diamond in the figure indicates: Wind and hail disasters.
The green circle in the figure indicates: Typhoon disaster.
The pink triangle in the figure indicates: Earthquake disaster.
The purple diamond in the figure indicates: Low temperature freezing and snow disaster.
Note: data on Taiwan, Hong Kong and Macao are not available.
Related maps
Online map of China's January disaster distribution in 2014
Online map of China's February disaster distribution in 2014
Online map of China's March disaster distribution in 2014
Online map of China's May disaster distribution in 2014
Online map of China's June disaster distribution in 2014
Online map of China's July disaster distribution in 2014
Online map of China's August disaster distribution in 2014
Online map of China's September disaster distribution in 2014
Online map of China's October disaster distribution in 2014
Online map of China's November disaster distribution in 2014
Online map of China's December disaster distribution in 2014
- Historical map of the Southern Song Dynasty and the Jin Dynasty in 1208 AD
- The Historical Maps of Qi State, Lu State and Song State During the Warring States Period in China
- Historical Maps of Chu State, Wu State and Yue State in Spring and Autumn Period of China
- A Historical Map of the Early Site of Chinese Primitive Society (Paleolithic Age)
- Online map of non-metallic mineral resources in Wenchuan disaster area in China