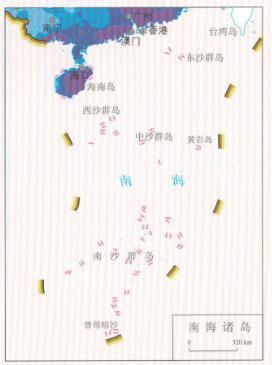
Online map of annual average precipitation of China in 2014
Map description
Map source
The online map of annual average precipitation of China in 2014 is from the Atlas of natural disasters in China in 2014, the book is edited by the National Disaster Reduction Commission Office, the Disaster relief Department of the Ministry of Civil Affairs, the National Disaster Reduction Center of Ministry of Civil Affairs, and is published by China Map Publishing House. The scale of this map is 1:16000000.
Online map of annual average precipitation of China in 2014

Connect to the map above.
Source: China Meteorological Administration.
Time: 1981-2010
Data on Taiwan, Hong Kong and Macao are not available.
In the figure, yellow means less precipitation, more green precipitation, and the closer the blue color to purple precipitation, the more precipitation.
- Historical map of the Southern Song Dynasty and the Jin Dynasty in 1208 AD
- The Historical Maps of Qi State, Lu State and Song State During the Warring States Period in China
- Historical Maps of Chu State, Wu State and Yue State in Spring and Autumn Period of China
- A Historical Map of the Early Site of Chinese Primitive Society (Paleolithic Age)
- Online map of non-metallic mineral resources in Wenchuan disaster area in China