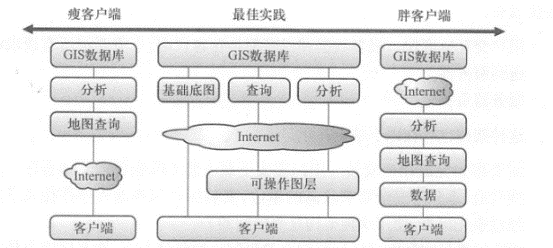
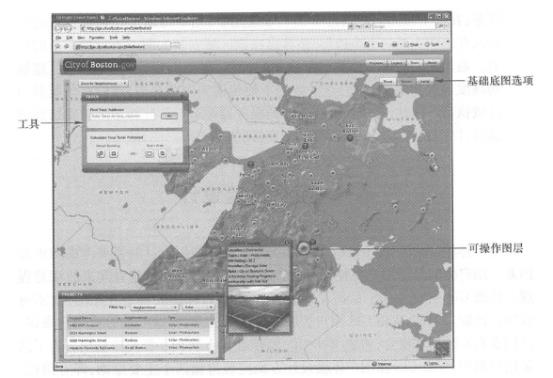
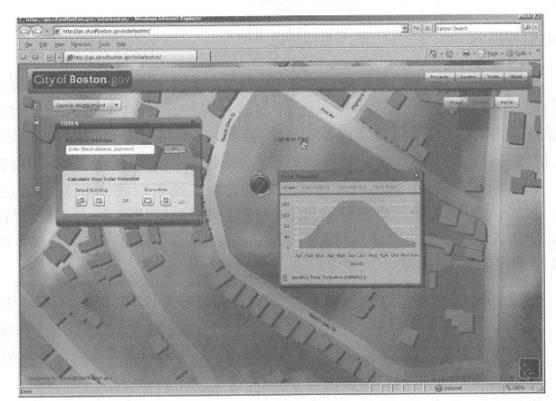
How to distribute functions between client and server? This is an issue that must be considered when designing client/server architecture products or projects. WebGIS can be divided into thin client architecture and fat client architecture according to different function allocation modes (Gong Jianya, 1999). This section will introduce an optimal allocation scheme with specific examples. In a normal thin client architecture, the client generally undertakes fewer tasks and is mainly responsible for sending requests to the server; while the server undertakes most of the processing work, such as generating maps and performing relevant analysis, and returns text, tables, GIF, PNG or JPEG maps in HTML and other ways. For example, PARC Map Viewer(Figure 1.6), the world’s first WebGIS application, is a typical thin client architecture. The main advantages of this architecture are: Users do not need to install any GIS software and plug-ins other than Web browsers; Most geographical operations are interpreted and executed by the GIS server. The client does not need to configure a powerful computer and can also run normally on low-end computers. The main shortcomings of this architecture are as follows: The burden on the server is heavy. The vast majority of geographical operations rely on GIS servers; Weak interactivity. User interfaces are often built using ordinary HTML and some simple JavaScript, and are generally not expressive. In contrast to thin clients, fat clients assign more tasks to clients. This architecture is mainly achieved by installing corresponding Web browser plug-ins (such as Flash and Silver-light) on the client computer, or by employing client native (or embedded) applications. The main advantages of this architecture are: User interaction is fast. A lot of data and programs are on the client side, and there is no need to send all requests to the server. The server burden is light. This architecture also has the following shortcomings: Corresponding installation needs to be completed in advance. Users need to download and install GIS plug-ins or local programs. In some units with high security requirements such as the government and the military, the installation of plug-ins and local programs often requires prior approval, and the use of this architecture is restricted. Facing limitations in network bandwidth and client computing power. In general, it is often not feasible to transfer hundreds of megabytes or gigabytes of data over the Internet or perform high-intensity geographical analysis calculations on the client side. In recent years, client-side technologies, such as plug-ins, JavaScript and HTML5, have become increasingly powerful, and have been able to undertake more and more work tasks. At present, one of the best models that is widely used is to divide the functions in a project into three major components: basic basemap, operation layers and tasks, such as Equation 2. 1 and Figure 2. 9 (Quinn, 2008 ; Brown et al., 2008). WebGIS application = basic basemap + operation layer + task (2. 1) wherein Basic basemap: Shows the geographical location and environmental fundamentals of a project and should usually be generated on the server. Basic basemaps are often relatively static and update frequently, so you should try to pre-create tiled maps as much as possible to improve browsing speed (see Section 3.5.1). Action layer: Drawn on top of the basic basemap, is the theme layer for end-users to browse, query, or edit operations. Normally, the coordinates and attribute information of the operating layer are downloaded to the client, and the client is responsible for managing and rendering the expression. The advantage of this approach is that users can quickly interact with it, such as displaying its feature attributes or related reports by clicking a mouse. When the amount of data on an operation layer is too large and it is difficult for the client to display it all, you can consider using scale dependence, that is, the operation layer will only be displayed when the map is zoomed in to a larger scale. In some cases, you can also use server-side dynamic or tiled maps to create and display operation layers. Tasks:WebGIS applications often provide multiple tools, such as general tools such as addressing, navigation, and querying, as well as dedicated tools for user organizations. If the data required by a function is on the client side, or the calculations required by the tool are relatively simple, the task can be assigned to the client side to complete; if a function relies on a large amount of data, the data is all on the server side, or the calculations required are relatively complex, such tasks should be handed over to the server. Fig. 20 According to the current best division of labor model, basemaps are generally produced on the server side, and operation layers are usually displayed on the client side. Simple analysis tasks can be completed on the client side, while complex tasks or involving large data volumes need to be completed on the server side. # Solar Boston adopts the above best division of labor model (Figure 2. 10)。The project was initiated and supported by the U.S. Department of Energy and aims to promote solar energy, reduce greenhouse gas emissions, and help Boston residents and relevant departments achieve the goal of installing a total of 25 MW of solar power facilities by 2015. In order to let the public understand and track the progress of solar facilities and allow users to estimate the solar potential on their roofs, the Boston Renewal Authority used ArcGIS Server and the early ArcGIS Flex interface in 2008 to develop the Boston Solar Project WebGIS application (Knight,2009), which applies the best application division model of basic basemaps, operating layers and tasks. Basic Basemap: The Boston Solar Project WebGIS application provides three types of basemap, namely street basemap, terrain basemap, and aerial image basemap. They are drawn based on authoritative data from the city of Boston and include each building’s roof information. These base maps mainly help users understand the basic situation of Boston, understand the site selection of green energy projects, and understand the relationship between these projects and the surrounding terrain and buildings. The basemap is pre-created with multiple levels of caching on the server side, with a scale ranging from 1:80 000 to 1: 1,250. Operation layer: In the Boston Solar Project WebGIS application, green energy projects are the operation layer, in which the coordinates and attribute information of the projects are extracted from the server and transmitted to the browser. The browser uses the ArcGIS API for Flex to dynamically classify each item, using different icons to display different types of attribute items (solar energy, biomass energy, water energy, or wind energy). When the mouse hovers over each green energy project, an information window will immediately pop up, showing its generation wattage and photos. Fig. 21 The Boston Solar Project WebGIS application consists of a basic basemap, operational layers and tasks, demonstrating an optimal division of labor between servers and clients. (Thanks: Boston Bureau of Renewal) # Fig. 22 In the Boston Solar Project WebGIS, the calculation of the solar energy potential received by the roof or the ground is complex and the amount of data required is huge, so this task is assigned to the server side. (Thanks: Boston Bureau of Renewal) # Task: In the Boston Solar Project WebGIS application, users can select the roof of a building or draw a polygon on a map to estimate the electricity that may be generated by installing solar panels in the area. The calculation of ground solar energy potential is an intensive operation and requires the use of a large amount of data such as digital high-rise models and building heights. Moreover, these data are inconvenient to be transmitted to the browser and are difficult to execute efficiently in the browser. Therefore, this function is assigned to the server side to run. The calculation results are sent to the browser and displayed to the end user in the form of a chart (Figure 2. 11)。Thin client architecture #
Fat client architecture #
best mode #