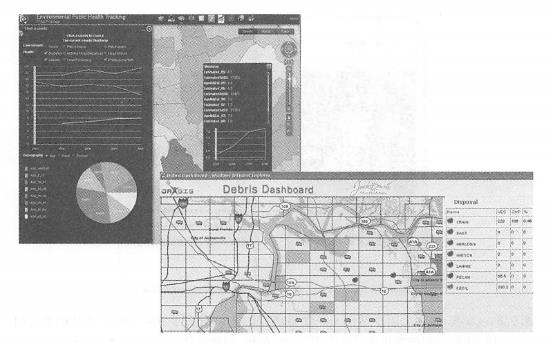
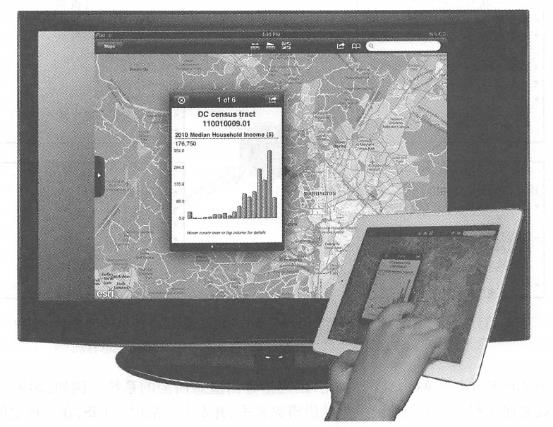
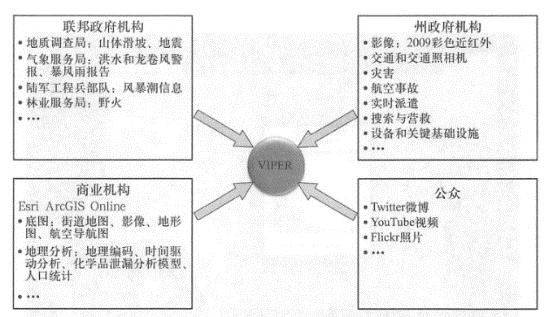
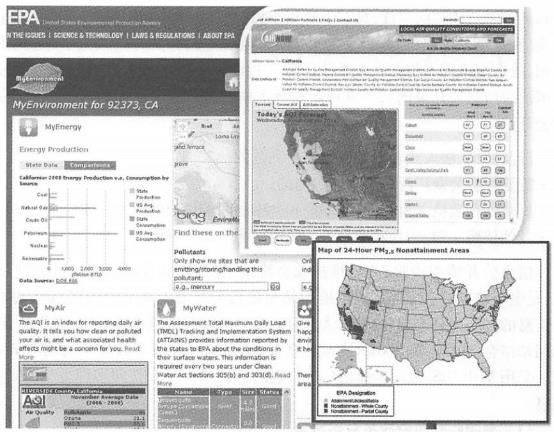
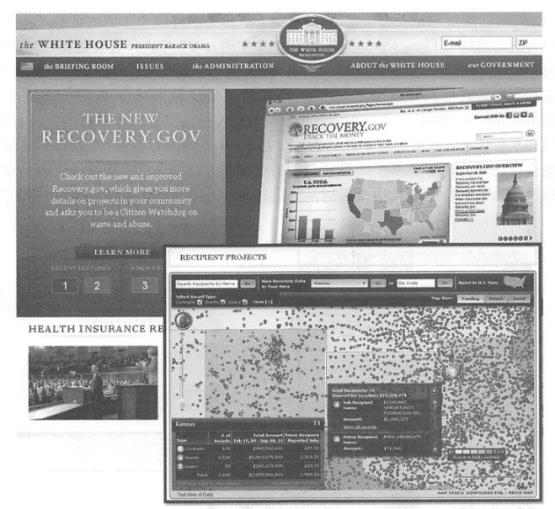
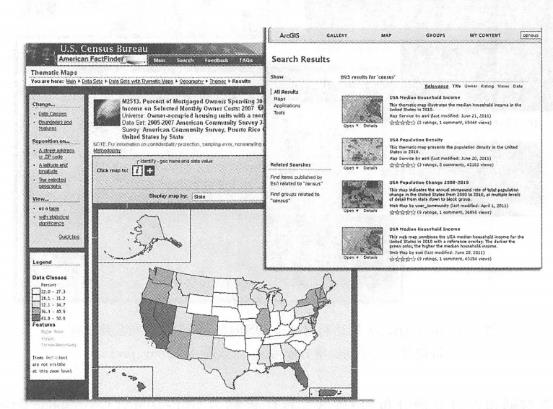
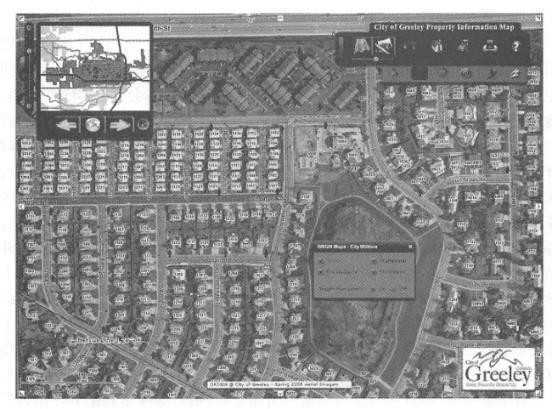
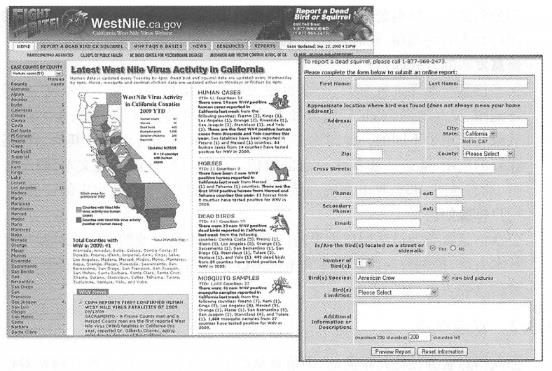
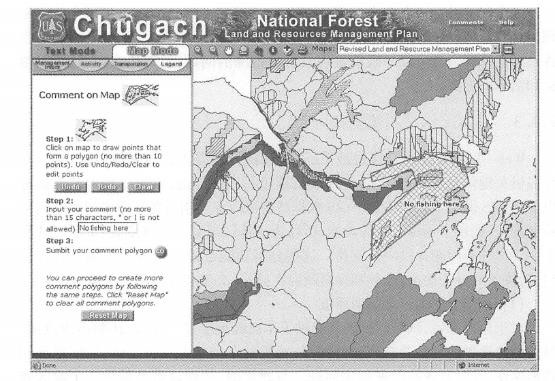
WebGIS has many applications in the field of e-government. This section summarizes them into three main types: the first type is public information services, which use WebGIS to provide information to the public; the second type is two-way communication between the government and the public based on WebGIS; the third type is the government using WebGIS for daily operations and decision-making management. Of course, the application of WebGIS is not limited to these three types, and these three types are not completely unrelated. For example, a public information service website can also be part of the government’s daily operations. Citizens have the right to know, and the government has the responsibility to disclose information, which has a constitutional or special legal basis in many countries. The United States passed the Freedom of Information Act in 1966, which came into effect in 1967. It stipulates that the people have the right to understand and know about national decisions, government affairs, and events that occur in society that are closely related to citizens ‘rights and interests. Government information has the nature of public property (except for those involving state secrets, commercial secrets and personal privacy), and everyone has the right to obtain it. The government’s refusal to provide information bears the burden of proof. China also issued the “Regulations of the People’s Republic of China on the Disclosure of Government Information” in 2007, which stipulates that government information that meets one of the following basic requirements should be voluntarily disclosed: Involving the vital interests of citizens, legal persons or other organizations; Those requiring widespread awareness or participation by the public; Reflecting the institutional establishment, functions and procedures of the administrative agency; Others that should be voluntarily disclosed in accordance with laws, regulations and relevant national regulations. Information disclosure can eliminate rumors, maintain social stability, promote popular politics, and realize citizens ‘supervisory power. It is an important task of e-government. Government websites are the main platform for information disclosure and a convenient way for the public to understand government information. As mentioned earlier, most government information is related to geographical location, so WebGIS technology that combines GIS and websites is an important technology to intuitively and dynamically display a lot of government information. Using WebGIS, the government can provide an intuitive interface for the public to access various types of government information. (1)U.S. federal government government application cases Most federal government departments in the United States have adopted the Web and WebGIS to disclose information. For example, U.S. Geological Survey: Provides near-real-time information on natural disasters, including earthquakes, floods, hurricanes, landslides, tsunamis, volcanoes and forest fires (see Figure 1. 11)。Making the public aware of this information can Carry out prevention and response. National Meteorological Administration: Release near real-time weather information status and climate and weather forecast maps. This information is needed by departments and groups such as public life, travel, ground and air transportation, and Incident Response Service. Centers for Disease Control and Prevention, a subsidiary of the U.S. Department of Health and Human Services: uses WebGIS to publish information on infectious disease outbreaks, environmental disasters, and population health, making it easier for the public to access and understand this information. Federal Emergency Management Agency: Through the Web GIS is used to publish flood risk grading maps to facilitate risk assessment by individuals and insurance companies. U.S. Environmental Protection Agency: Through the “My Environment” webpage, including columns such as “My Air”,”My Water”,”My Land”,”My Health” and the “Current Air” webpage, it uses maps and reports to provide the public with timely information on the quality of the atmosphere and water environment and the distribution of pollution sources (Figure 9. 2)。The information is timely and detailed. For example, air quality includes data on indicators such as particle size less than 10pm (PM10), particle size less than 2.5jjLm (PM2_5), sulfur dioxide, carbon oxide, carbon monoxide and ozone. White House: The federal government also uses WebGIS to increase government transparency and promote accountability. Using GIS technology to organize and manage data can make complex information easy to understand and access, contributing to the development of government transparency and accountability. After the public understands the government’s management process, they can participate more actively and effectively in the government’s work. In 2009, the Obama administration used the Internet as the main channel for publishing information related to the American Recovery and Reinvestment Act (ARRA). In September 2009, it launched the Recovery, gov website (Figure 9.3) to provide the latest regional allocation of $787 billion in economic stimulus funds. On this Web map, the public can see how much money each state, county, and city receives, which units and projects the funds are allocated to, and where these units and projects are, so that the general public can understand and supervise the use of funds in a timely manner. Fig. 105 The U.S. Environmental Protection Agency uses web pages such as “My Environment” and “Current Air” to provide timely environmental information to the public in the form of maps and reports. (Acknowledgement: U.S. Environmental Protection Agency) # In addition, it is worth mentioning that some federal government departments not only provide maps, but also provide map services, source data (such as shapele format, CSV format), and even measurement results from many sensors for the public, business and scientific research institutions to download, use and application development. (2)census data The U.S. Census Bureau is a model for using GIS in business processes. They use GIS technology to collect, process and publish U.S. demographic information; WebGIS is used to share information with other government departments and the public. The U.S. Census Bureau implemented programming to process population in the 1960s Fig. 106 The Recovery, gov website uses WebGIS to promptly announce the allocation of funds in the federal government’s economic stimulus plan to the public. (Thanks:Recovery,gov ) # Census data and geographical distribution information of population. This program is called GBF/DIME(Geographical BaseFile/Dual Independent MapEncoding). It encodes the topological relationship of each street section, changes the way census works, and also has a significant impact on the development of GIS. During the 1990 census, the U.S. Census Bureau collaborated with the U.S. Geological Survey to establish the TIGER(Topologi·cally Integrated Geographical Encoding and Referencing) system. It allows the U.S. Census Bureau to correlate household data collected by physical address with census units and administrative boundaries. TIGER linear feature files include streets, rivers, legal boundaries, boundaries of demographic units, and other geographical thematic data across the United States and can be visualized using GIS software. In 1994, the U.S. Census Bureau became one of the first government departments to establish a website portal. The bureau’s portal (WWW. census, gov) provides direct access to demographic databases to the public, businesses and other government agencies. In 1994, the bureau launched a website called “American FactFinder”, which allows users to create demographic maps and reports. The website also provides population information and thematic maps at the state, county, city, zip code, etc. levels, allowing users to quickly understand the data in the demographic tables (Figure 9.4). Publishing information through the website has greatly reduced the number of paper documents printed and printed. According to Louis Kincannon, former director of the Census Bureau: “Ten years ago, the 1990 census data used 450,000 pieces of paper. If these pieces of paper were connected, they would be 78 miles long. The 2000 census data was released directly on the Internet, and the use of paper was reduced by 75% compared with the original “(U. S.Census Bureau,2004)。What is more valuable than reducing paper consumption is the improvement of work efficiency and the social and economic value brought by information sharing. During the 2010 census, the Census Bureau configured ArcPad mobile GIS for censors to make household visits to households that did not return questionnaires or were difficult to identify, and to submit information to the server via the World Wide Web in a timely manner. Fig. 107 The U.S. Census Bureau uses WebGIS to publish census information. Left: The proportion of households in each state that spend more than 30% of their monthly income on repaying their home loans. See the legend for specific rankings. Right:EsriArcGIS Online can find hundreds of demographics-related Web map services and applications, all of which are processed and derived from Census Bureau data. (Acknowledgement: U.S. Census Bureau) # Local government application cases Local governments usually use Web maps to provide local land planning zoning, real estate assessments, crime distribution, urban infrastructure and its maintenance information, street closure information, etc. For example, the City of Sacramento (the capital of California) applied GIS to its website in 1998. The original purpose was to replace planning department staff with Web maps to answer public inquiries about urban planning, so that the public could get answers from the Web map themselves. Later, the WebGIS also provided three other types of maps: general maps, property maps, and vicious crime maps. General maps provide council zoning, street service zoning, and city service information; property maps provide information related to tax assessments, such as location information on urban planning zoning, public schools, parks, streets and rivers; and malicious crime maps show information on where kidnapping, assault, deception, theft and homicide crimes occurred. The city’s website verified that WebGIS is a low-cost, efficient way to serve public information. It is estimated that in 2001 alone, without the site, more than 500 people would call or go to City Hall a day to inquire about the issues they wanted to know. By multiplying the number of staff by the hourly wage to answer these questions, WebGIS saved the city $1.8 million in annual expenses (Walters, 1999). Another example is the WebGIS website established by the government of Greeley, Colorado, which allows the public to quickly search for information. Property information map of the city (Figure 9. 5)It was developed to satisfy the planning department’s Community Development Division and the general public. In the past, staff from the city’s planning department spent three to four hours a day answering the phone and answering general questions from the public about real estate. In 2009, the real estate information map website provided by the city freed government office workers from this inefficient and repetitive work, providing better services to the public and reducing government office expenses. Fig. 108 The city of Greeley, Colorado uses WebGIS to provide information services to the public. Using this website, the public can immediately get comprehensive land plot information, from functional zoning in urban planning, school district boundaries, to the nearest fire hydrant. (Thanks: Greeley, Colorado) # Megan Act In 1994, a 7-year-old girl named Megan in New Jersey, USA, was raped and killed by a neighbor. After solving the case, Megan’s parents learned that this evil neighbor had been imprisoned twice for molesting children. Before that, the community had no idea about it, which made Megan’s parents particularly indignant. In order to avoid a recurrence of similar tragedies, they called on the government to amend the law to force sex offenders, especially criminals against children, to register their addresses with the local public security department no matter where they move after being released from prison. The government should disclose the addresses, criminal records and physical characteristics of these criminals to the public to remind local residents to be vigilant. A few months later, New Jersey passed the law, known as the Megan Act. In 1996, the Clinton administration approved the Megan Act as a federal law requiring it to be extended to all states. WebGIS contributes to the implementation and enforcement of the Megan Act. Initially, information about sex offenders was provided through multiple media such as newspapers, brochures, and telephone calls; later, many state and city governments adopted Web maps to visually publish this information to people. For example, the California Department of Justice provides such a website ( http://www . meganslaw. ca. gov), the public can search by county, city, zip code, address, school and park. The website will display the results of the search on a map, mark the addresses of the criminals on the map, and list their names, photos, physical characteristics and crimes committed and other information. This kind of measure has had a significant effect on deterring and preventing sexual crimes, especially protecting children’s rights and interests. transparent government Martin O’Malley (former mayor of Baltimore, USA and current governor of Maryland). During his tenure as mayor of Baltimore, he deployed a GIS application system called “ComStat” to analyze the distribution of criminals and assist the city government in deploying police forces. This application gave him an understanding of the role of GIS. In 1999, he supported the development of the “CitiStat”(City Statistics) system, initially mainly to supervise and combat absenteeism in municipal construction. The app saved the government $13.2 million in municipal expenses in its first year. Later, the city government expanded CitiStat’s functions and used it to manage all municipal engineering projects, from the repair of road potholes to the construction of large infrastructure projects. How much of each project has been completed and how much money has been spent is shown graphically on the map so that both the public and city officials can see it at a glance. This is the basis for municipal meetings to discuss and manage project progress. In the first four years alone, it saved the government $100 million. CitiStat won the Harvard Kennedy School of Government Innovation Award in 2004 and has been rolled out to a dozen other cities. O’Mal-ley believes that GIS is an important means of creating government performance. “Using GIS to monitor and analyze the progress of our work, we can reduce spending, increase revenue, and improve the quality of services to the public. Governments should be accountable and efficient, and GIS can help us achieve this,”said 0 ‘Malley (4rc/Ve«, 2009). After being elected governor of Maryland in 2006, O’Malley continued to advocate GIS as a tool to improve government work. Based on the above-mentioned CitiStat, he advocated the development of “StateStat”(State Statistics). Similar to CitiStat, StateStat oversees the performance of state government departments and publishes various relevant information to the public through online maps. StateState has evolved from being originally used only in the fields of public safety, medical and social services, to police, agriculture, business and economic development, environmental protection, general affairs, health, housing and community development, human resources, youth education, labor, licensing, regulations, natural resources, planning, public safety, transportation and other departments. It uses WebGIS as a platform for information communication between government departments and between the government and the public. The public can obtain the distribution, progress and benefits of relevant projects at any time through the StateState website, which is convenient for supervising the work of the government, evaluating the performance of the state government, and improving the work efficiency of the state government. The main issues to consider in information disclosure When planning or evaluating a public information service project, there are the following issues to consider: What information is released? Is this information of concern and need to the public? Environmental information such as water and air quality, health, disasters, infectious disease epidemics, crime, government fund allocation, urban development planning and functional zoning, school distribution and school districts, and demographic information in the above examples are all related to the public’s daily life and rights are closely related and are information of concern to the public. Is it detailed, comprehensive and in-depth to meet the public’s requirements in breadth and depth? Take air quality information as an example. Will it only publish an overall air quality index, or does it include data on various pollutants, such as smoke, PM10 suspended particulate matter, PM2.5 suspended particulate matter, nitrogen dioxide, sulfur dioxide, carbon monoxide and ozone? How timely is the information? Is it timely? Historical data is indispensable for analyzing certain issues, but the latest information is often more closely related to the public and is therefore of the greatest concern to the public. Public information services need to be more timely and announced to the public as soon as possible. Delaying the announcement or concealment of events often leads to public speculation, leading to the spread of rumors and unrest among the people. The timely release of government information is the best way to eliminate rumors and speculation. How is information released? A lot of information is related to geographical location, and the public is also very concerned about the location of this information. Text web pages, static maps, interactive maps, Web feeds, and Web services can all convey geographical information, but their effects and effects are different. Maps are more intuitive than text, and Web services can allow other organizations to build new applications and further expand the value of information. For example, the USGS publishes information on natural disasters through multiple methods such as text, static maps, dynamic maps, RSS, Web services, and data downloads. How is the user experience? The end users of public information services are mainly the general public, not professional GIS personnel or information technology personnel. WebGIS providing public information services must be easy to use, the system must respond quickly, and the interface and information must be intuitive and easy to understand. Public information services are often one-way, that is, information flows from the government to the public. Many government websites have expanded this one-way information release model, realizing two-way communication between the government and the public. For example, some government websites allow the public to comment, make service requests, and conduct various online processing, including online tax payment and application for building permits. User participation and interaction between users are important features of the current Internet. Wikis, blogs and Social networks have emerged one after another, producing a large amount of “user-generated content.” The functions of WebGIS have also changed the mode of one-way communication and become a new platform to assist the public in participating in government affairs.”Spontaneous Geographic Information”(VGI) is one embodiment. This model provides new ways for users to participate in government affairs and has been used by some forward-looking departments. (1)public health The spread of infectious bacteria and diseases has an important impact on public health, and monitoring the spread of diseases requires public participation. The U.S. Centers for Disease Control and Prevention used a crowd-sourcing approach several years ago to mobilize the public to monitor the spread of the Seniro River virus. West Nile virus disease is an infectious disease caused by West Nile Virus (WNV) and is a zoonotic disease. It was first discovered in the West Nile region of Uganda, Africa, and spread to North America in 1999. Birds were infected first, and within three months, cases of human infection with the virus appeared. The virus is transmitted to humans and other animals by mosquitoes that suck blood from infected birds, and can cause encephalitis and death. In early 2000, the U.S. Centers for Disease Control and Prevention and other departments used the Web and GIS to monitor and publish the spread of West Nile virus. For example, the California Department of Public Health, Food and Agriculture, in partnership with the University of California Infectious Disease Center and the California Mosquito Vector Disease Control Association, has launched a website that allows the public to report the locations of birds and squirrels suspected to have died from the pathogen (Figure 9. 6), so that staff can go for inspection and testing to confirm whether the virus has spread here. The website also reports where West Nile virus has spread, how many people or animals have been infected, and reminds the public to take precautions. Fig. 109 WestNile.ca.gov released the spread of West Nile virus to the public and mobilized the public to report suspected cases to jointly monitor the spread of the virus. (Thanks: California Department of Public Health and WWW. FightTheBiteColorado.com; mosquito icon drawn by Gary Sky and Vicki Gullickson) # (2)environmental impact assessment In 1969, the United States enacted the National Environmental Policy Act (NEPA). NEPA is called the “National Basic Charter for Protecting the Environment”. It stipulates the environmental impact assessment system and stipulates that environmental impact assessments must be conducted for government legislative proposals or other actions and project developments that have an impact on the environment. A distinctive feature of the U.S. environmental management strategy is to attract the public to participate in environmental impact assessments. Before making relevant decisions, the government must first conduct environmental impact assessments and prepare environmental impact assessment reports. It must also solicit public opinions and conduct public comments as part of the preparation of an environmental impact assessment report. The necessary procedures and content of the assessment report. The traditional method of public participation is a hearing. For example, the public goes to the city government hall for a meeting one night to listen to government officials introducing the city’s plans or development projects, and ask the public to express their opinions within one or two months. The public can speak on the spot, or express their opinions by writing letters and faxes. WebGIS provides a more efficient method. For example, the U.S. Land Service and the U.S. National Forest Service launched the “ePlanning” project in 2002 to introduce the government’s plans or projects through interactive electronic maps. The public no longer has to go to the city hall. They can sit comfortably at home and use WebGIS technology to obtain current planning documents, view planning-related maps, and discuss ecological restoration, Wildlife protection and energy planning, etc. express their views. Users can mark directly on a Web map, publish their suggestions easily and accurately (Figure 9.7), and participate in planning and environmental evaluation (Zulick, 2004). The website automatically archives users ‘suggestions after receiving them and provides relevant functions for government departments to inquire and respond to public suggestions. Fig. 110 In 2003, the U.S. Forest Service’s ePlan Hiding Pilot Project in the Chugach Forest Area, Alaska, used WebGIS to allow the public to easily view information on government plans or projects, and to mark them on maps and publish suggestions. (Acknowledgements: U.S. National Forest Service and U.S. National Land Service) # Urban environment and facility monitoring People often find safety hazards or problems that affect the city appearance such as illegal dumping of waste, graffiti on buildings, road damage, broken water pipes, and damaged street lights. To whom do you report these situations? How to accurately describe their location and condition? Many people don’t know it and it’s inconvenient to describe it. Although city governments have some supervision and management departments for city appearance and municipal facilities, they are often understaffed and difficult to inspect all streets and every corner of the city anytime and anywhere. CitySourced in the United States was established in 2009. Its business is to use GIS and crowdsourcing methods, which not only allows the public to easily report the above problems, but also solves the problem of insufficient government manpower. City-Sourced uses WebGIS and mobile GIS technology to develop applications for smartphones such as iPhone, Android and Windows Phone, allowing the public to use the mobile phone’s GPS positioning function, photography, video and recording functions to report the accurate location and exact status of these issues (Figure 9. 8)。These reports are recorded on CitySourced’s servers and geodatabases. CitySourced has established cooperative relationships with more and more municipal governments and will send questions to relevant municipal government departments based on the type of questions. The public can submit reports anonymously, or they can leave their names and contact information so that CitySourced can send reminders when there are new processing developments on their submitted reports. In addition,CitySourced also provides a WebGIS website so that the public and local government units can see the problems reported by the public, so that municipal departments can make maintenance plans and dispatch arrangements, and solve these problems through the best route. Labor costs are the largest expense in office expenses in cities in the United States. CitySourced uses spontaneous geographical information and crowdsourcing methods to mobilize the public and save government funds. CitySourced’s event map allows managers to identify problems within their jurisdiction at a glance, identify hot spots, and find solutions to address the symptoms and root causes. WebGIS can clearly display information through maps, tables and statistical charts, provide key information or analysis results online, and managers can use GIS to make important decisions through an easy-to-use interface without technical training. GIS data modeling can provide a deeper insight into spatial relationships and patterns among various elements, providing decision support for issues ranging from community planning to global warming, resource scarcity and biodiversity. These analytics capabilities can also be made available as WebGIS for use by government offices to improve and enhance government collaboration, communication, and analytics capabilities. (1)Map-based overview management panel For the driver, the dashboard of the car provides information such as how much mileage the car has traveled, how much gasoline is left, how the current speed is and whether there is a fault. The driver has a clear view of the car’s condition, can grasp and adjust the speed, and detect problems in a timely manner. and solve problems. Similarly, if government officials want to lead a region or department, they also need a dashboard-like checklist. Maps have the ability to integrate information. They display the status and progress of various events in a region on a map in the form of legends or statistical charts, making them into a list with a “dashboard” effect to help government officials grasp the situation and make decisions (Figure 9. 9)。 Fig. 111 CitySourced uses WebGIS and mobile GIS technology to develop applications for smartphones such as iPhones, allowing the public to use the mobile phone’s GPS positioning function, photography, video and recording functions to report the exact location and accurate status of municipal issues. (Thanks:CitySourced Company) # The city government of Jacksonville, Florida, has developed a WebGIS application to assist government operations and speed up the government’s response to public requests. With a population of 850,000 and an area of 841 square miles ®, the city faces complex urban infrastructure management and logistics services issues. Most departments in the city have applied GIS technology, and through WebGIS, they provide the information they have to managers of each department to improve the department’s business operation effectiveness. The Jacksonville City Department of Information Technology has developed a JAXGIS map bulletin board that allows managers to monitor the city’s operations. When the public contacts the government by phone, email or online to apply for services or make complaints, these applications or complaints are classified and coded, assigned to the corresponding department for processing, and registered and displayed on the JAXGIS map bulletin board, and dynamically marked in different colors. Their status is marked (Figure 9.9). Managers can clearly see current and past processing requests, as well as their distribution and number, which helps managers identify potential problems, analyze response times, reallocate resources, and improve government business operations. Government transparency is not only important to the public, but it should also provide government workers with an information window so that they can get the information they need for their work in a timely manner. Since the advent of the iPad, government and business users have been eager to explore how to use this “gadget” in “serious” office businesses. For example,Accela recognized early on that it could use iPad to transfer data to office workers in real time. Accela has developed a series of iPad-based apps and are already used by hundreds of government agencies. These iPad apps use Esri’s ArcGIS for iOS programming interface to call map services from ArcGIS Online cloud GIS, and integrate Fig. 112 The map-based list management panel can display the status and progress of various events in a region on a map in the form of legends or statistical charts, creating a list with a “dashboard” effect to help government officials grasp the situation and make decisions. Top: A list of environmental and health indicators adopted by multiple states in the United States and their annual trends; bottom: The map panel of the city of Jacksonville dynamically displays the status of public handling information about waste complaints. (Acknowledgements: U.S. Environmental Protection Agency and the City of Jacksonville) # Integrate professional data map services from various government agencies. These apps allow government employees to obtain building permits, business licenses and other municipal information anytime, anywhere, displaying this information in the form of maps, text and statistical charts. Whether they are in their office or on the road, whether they are in a meeting or doing research, with the click and flick of their fingers, they can browse the map and grasp the situation (Figure 9.10). (2)Natural disasters and emergency management Disasters such as floods, tornadoes, earthquakes and fires do not care about city boundaries, county boundaries and even national borders. Responses to these disasters and emergencies often require joint actions by multiple administrative districts and departments to coordinate the deployment of resources, share information, share analysis results, establish strong and tacit response mechanisms, and communicate with the public and the media. Different departments only collect data within their own jurisdiction or within the business scope of their own department, and emergency needs to integrate multiple information resources from various places. This is precisely the strength of GIS. WebGIS extends the dissemination scope of geographical information and can provide a “common operational picture” for these emergency departments distributed in different locations. It plays an important role in promoting large-scale and cross-department collaboration and has also been an application hotspot of WebGIS in recent years. Emergency response has been introduced in other chapters of this book, but only a brief supplement is made here. The Virginia Department of Emergency Management (VDEM)’s “Virginia Incident Response Service Interoperability Picture for Emergency Response”(VIPER) demonstrates the capabilities of WebGIS to integrate information from multiple sources. In 2008, V DEM decided to build a situational awareness needed for emergencies Fig. 113 Tablets such as iPads and smartphones are like offices accompanying each other, providing a variety of geographical information to the hands of government office workers, browsing maps and grasping the situation between the clicks and clicks of their fingers. (Acknowledgement: U.S. Census Bureau) # System, comprehensively integrate multiple systems to enhance information sharing, exchange and analysis. V DEM analyzed information resources from more than 100 websites and incorporated many of them into applications (Figure 9. 11), provides real-time assessments and cartographic displays for the Virginia Department of Emergency Management and other agencies. For example, if a serious traffic accident occurred on a certain road section, causing many injuries, the system can provide timely information from nearby hospitals to transport and rescue the injured; in the event of a dangerous goods leak, the application can quickly calculate which schools may be affected, shopping malls or other units and neighborhoods that need to be evacuated, and warn of the impact of the leak on critical infrastructure. The project has been used in major natural disasters and important national security events-such as Tropical Storm Hannah, the presidential election and Obama’s inauguration-providing geographical integration, visualization and analysis capabilities for many different agencies, supporting emergency management of these activities. Another requirement for emergency management is development speed, which requires GIS departments to develop and deploy the latest data and related functions in the shortest possible time so that they can be put into use as quickly as possible. To this end, more and more departments are using cloud GIS. Cloud GIS does not require local installation of hardware and software, and can complete the deployment of ArcGIS Server in the Amazon cloud in tens of minutes. After developers upload data and maps, they can publish geographical Web services, which can be used by ArcGIS. com or the emergency unit’s own Fig. 114 The Virginia Department of Emergency Management reused and combined multiple information resources from the federal, state governments, business and the public, and established an emergency management interoperability chart to assist Virginia’s emergency management # Calls such as ArcGIS Portal and Web APIs quickly build the system needed for emergency response. For example, during the flood disaster in Queensland, Australia at the end of 2010, developers used cloud GIS and completed the development and deployment of WebGIS overnight, supporting emergency management of floods in the region. This section summarizes and introduces three main models of Web pS application in e-government:① Public information services, which is the most significant application. i Two-way communication to promote public participation in government affairs. The application in this area started late and is also an important research hotspot, and the number of cases is increasing rapidly.③ Government operations and decision-making are mainly used within the government. Many departments are migrating or extending traditional desktop GIS office systems to WebGIS platforms.of public information services for #
two-way communication #
Government operations and decision support #