Spontaneous geographical information #
Since the beginning of the 21st century, user-generated content (UGC) has become an increasingly prominent phenomenon. Hundreds of millions of users have contributed massive amounts of data to the World Wide Web, allowing many websites such as Wikipedia, YouTube video sites, Facebook, Twitter and Weibo to develop, become popular and successful. In 2004, ABC listed bloggers as news figures of the year; in 2006, Time magazine selected Internet users as its person of the year.
Voluntary geographical information (VGI) is geospatial data created voluntarily by the public rather than by professionals in professional data production departments (Good-child, 2007). Spontaneous geographical information is geography-related UGC. Websites such as WikiMapia, OpenStreetMap, and SeeClickFix use Web-based “crowdsourcing” technology to outsource these traditional tasks such as data collection and urban facility monitoring to the public, who voluntarily collect and upload data and report on problems found. Table 1 Some examples of popular spontaneous geographical information are listed, including the geographical issues they raise, user usage patterns and the geographical information collected.
Website names and their hidden geographical issues | user usage patterns | Geographical information collected |
|---|---|---|
WikiMapia: What places do you know? | The user draws an area on the map and briefly describes the area | Created the world’s largest database of place names |
Online photo album and video sites with geotagging capabilities such as YouTube, Picasa, Flickr: What photos and videos can you share about places you have visited? | Users upload their photos and videos and locate them | Use photos to record and report the past or present situation of a place or event |
OpenStreetMap:你有哪些道路等地理数据可以上传? | When walking, cycling or driving, users use GPS to collect road signs, upload and integrate them into the open-StreetMap website | Created geographical data such as streets and highways covering Europe and many regions |
CitySourced, SeeClickFix: Where have you seen what needs to be repaired? | Users use a website or mobile app to report where they have seen problems such as potholes on the road, graffiti on the street and street lights that need to be replaced | Identify infrastructure in need of repair for transportation and municipal departments |
Twitter, Weibo: What’s happening there? | Users report their activities and conditions or emergencies in their areas | Monitor and report on individual and community activities in real time |
Some examples and applications of VGI are mentioned in chapters 7 and 9 of this book. Twitter’s GeoTweeting feature is a good example of promoting spontaneous geographical information (Figure 10. 1 book). Twitter is a Weibo social networking site, similar to Sina Weibo, where users can send text messages and pictures and other attachments, known as “tweets.” Users can post and read Weibo through desktop clients or mobile clients. Users can post location information when posting Weibo, such as “A car accident occurred on the westbound section of the North Third Ring Road, and traffic jams were serious”, plus the location of the mobile phone’s GPS to post the news. Many functions like VGI can be implemented using Web editing functions such as those supported by ArcGISServer Feature Services. For example,ArcGISExplorer’s Twitter plug-in can help you publish GeoTweets and see GeoTweets of friends you follow (LaFraboise, 2009). ArcGIS Online Cloud GIS provides application templates that can automatically add Twitter and Weibo query and location display functions to the created WebGIS application.
Spontaneous geographical information provides a unique information and perspective for global observation, national spatial information infrastructure construction, and public participation in the development of GIS: Fig. 115 Left: Using the Twitter plug-in of ArcGISExplorer for the desktop version, users can query and display relevant Weibo blogs on a 3D map. Right:ArcGIS Online cloud GIS provides application templates that can add query and location display functions of Twitter and Weibo in the created WebGIS application. (Acknowledges: U.S. Geological Survey and Twitter) # 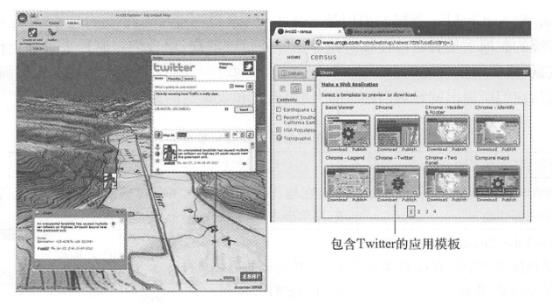
Use the public as a sensor: Today, a large proportion of the world’s 7 billion people have mobile phones or cameras that can collect and share geographical information at any time. Spontaneous geographical information provides a unique scale that aerospace remote sensing monitoring systems cannot provide. In terms of spatial resolution, people can discover detailed information that cannot be discovered by remote sensing because people can observe matters on the ground up close. In terms of temporal resolution, people can visit certain locations frequently, while satellites only visit them periodically. Spontaneous geographical information will become an important information source for a variety of WebGIS applications, including real-time disaster monitoring and early warning.
It provides auxiliary means for building spatial information infrastructure: traditional data production requires trained professionals and specialized data dissemination and promotion channels. At present, as government departments in many countries lack sufficient production of professional geographical information data, public participation is becoming more and more enthusiastic, providing a large amount of free spontaneous geographical information that is in most cases accurate and detailed. If quality control can be done well, it will provide a powerful auxiliary means for the development of spatial data infrastructure.
Promote public participation in the development of GIS: Public participation in GIS means that the public uses GIS to provide data and participate in decision-making. This concept was proposed at the National Center for Geographical Information and Spatial Analysis (NCGIA) meeting in 1996, but research found that most public participation in GIS projects was limited to research experiments and had not been widely used in practical applications (Batty,2007). Although most of the popular VGI in recent years have not yet reached the level where the public can use GIS to participate in decision-making, it can be regarded as a public participation GIS. Analyzing the reasons why it is popular, it is not difficult to see that the main reason is that the content is related to the public and can arouse public interest; the user experience is good, simple and easy to use, and the public is willing to use it; the platform is closely integrated with mobile phones, so the public can use it at any time; combined with Social networks, the user base is huge. If these methods are integrated into system design, it will help further promote public participation in the development of GIS.
Spontaneous geographical information has shortcomings such as disorder, non-standardization and redundancy, and there are some disputes in terms of quality, integrity and personal privacy. However, it is undeniable that most spontaneous geographical information is correct and has unique and important uses and is an important research area.
Collaborative GIS #
Collaborative GIS refers to a group of people using GIS technology to create a collaborative working environment to complete common tasks. Collaborative GIS has spatial and temporal characteristics (MaCEachren,2000):
In terms of space, collaborators can either be in the same place, such as discussing a new regional plan around a map, or they can stay away from each other, such as placing a map in front of each person and communicating over the phone;
In terms of time, collaboration can be either synchronous (real-time) or asynchronous (at different times).
Collaborative GIS is a new research field. It mainly studies how to use geospatial technology to support cooperation and decision-making between people. At present, the demand for collaborative GIS is increasing, especially remote synchronous collaboration. A large amount of planning and decision-making, especially Incident Response Service, needs to be accomplished through the collaboration of multiple groups or agencies, not all of which are located in the same location and may even be distributed across the world. A GIS that supports remote collaboration should have the following five typical system characteristics (MacEachren,Brewer, and Steiner,2001;Brewer et al., 2000).
Dialogue tools: Ability to communicate and dialogue while viewing and using GIS;
Consider group behavior: need to know what other participants are doing;
Attract the attention of other participants: By highlighting or dynamically marking locations or features, remind participants in other places to pay attention to the situation at the location and express their opinions;
Support working alone: Be able to work alone before sharing your ideas with others;
Support saving and sharing of work: At any point, you can save your own work, transfer it to others ‘work, and continue to analyze on this basis.
Essentially, collaborative GIS is the real-time sharing and exchange of data (maps, hand-drawn graphics, annotations, messages, reminders, etc.), which can be done between all participants or only among specific participants. For example, coordination is needed in an Incident Response Service. Emergency personnel move GIS through their mobile phones to report a chemical leak. This information is transmitted to the GIS server of the emergency command center. The emergency command center immediately runs the relevant geographical processing model to calculate areas that may be affected and need to be evacuated, roads that need to be blocked, shelters that need to be used, etc.; The calculation results are then transmitted to the police department, medical department and other emergency agencies, so that the police department can quickly and comprehensively close relevant roads and the medical department can provide emergency services in a timely manner. Collaborative GIS allows people to clearly understand the entire situation of things, and also provides participants with a common operational picture (COP) so that everyone can “see” the same information at the same time.
Collaborative GIS is the intersection of Web technology, GIS technology and computer supported collaborative work (CSCW) technology (Schafer et al., 2005)。Those widely used and popular cscw software include instant messaging software (such as real-time text chat), video conferencing software, Web conferencing software (which can share computer desktops), electronic blackboards, blogs, group short messages, Weibo, Web calendars and email. The new generation of collaborative GIS needs to integrate these CSCW technologies with WebGIS, or add similar functions to electronic maps to easily communicate geographical coordinates, annotations, text information, maps, model results, audio and video, etc. Figure 10. 2 shows a map-based electronic blackboard and chat software (Carmichael, 2009 ). Two good friends can discuss vacation attractions. One can draw the places he recommends on the map, while the other can immediately see the places his friend recommends and draw the places he recommends even if he is in a different place. Fig. 116 Chat application interface based on Web map. (Acknowledgement: U.S. Geological Survey) # 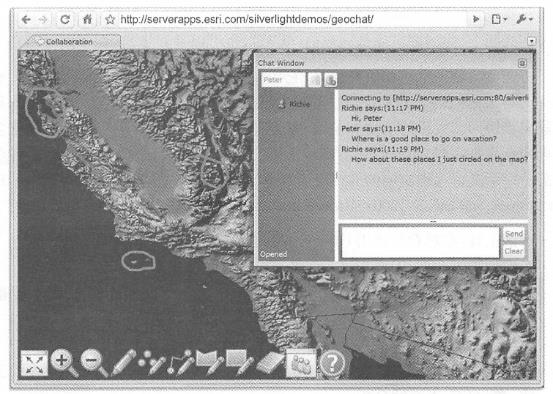
Future applications of collaborative GIS will be very extensive. In collaborative GIS, virtual teams do not need to face to work together to find solutions to problems. Collaborative GIS can create a virtual emergency command center, allowing multiple groups located in different locations to coordinate with each other in real time to complete complex Incident Response Service work. Through the Internet, collaborative GIS allows members of different teams to gather together in a virtual environment to participate in work in real time, quickly and accurately, reduce employee travel time and expenses, and integrate more people’s wisdom into various decision-making processes.
geotag #
Geotagging adds location information to various digital media such as photos, videos, web pages and RSS feeds. The location defined by geotags includes not only latitude and longitude coordinates, but also altitude and orientation. Geotagging of photos is currently the most popular type of geotagging and can be completed automatically or manually.
Automatic geotagging: Many current digital cameras, especially those on smartphones, have built-in GPS receivers that can automatically record the geographical location of photos. Some cameras even have built-in compasses. When taking pictures, the latitude, longitude and compass direction of the photo are automatically written into the picture file. In geotags, geographical coordinates mainly use latitude and longitude coordinates based on WGS84. For photos in JPEG format, geotag information is generally stored in the metadata area of the photo file in the form of EXIF(exchangeable image file) or XMP(extensible metadata platform) format. This information can be read and displayed by many programs.
Manual geotagging: You can manually specify the geographical location of photos taken with a camera without a GPS receiver. For example, ArcGIS Explorer’s Image Geotagger, available in ArcGIS. com), Picasa and Flickr provide tools that allow users to zoom in to the location on the map and specify the location where the photo was taken, and this location is written into the file of the picture (Figure 10.3).
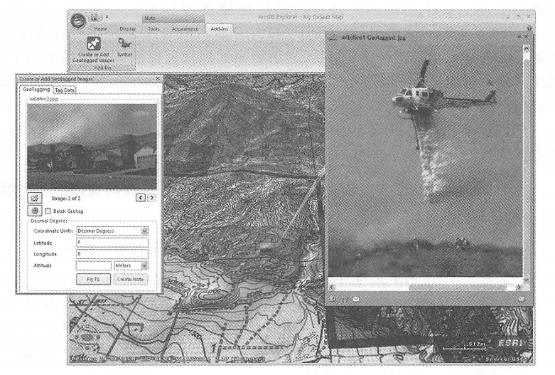
Fig. 117 Using the geotagging extension of desktop ArcGISExplorer, users can specify where photos were taken (left), and can also display geotagged photos at the corresponding location on the map. (Acknowledgement: U.S. Geological Survey) #
In GIS, the value of geotags is reflected in the following aspects.
Organize types of data such as photos according to spatial location: Many units and individuals have accumulated a large number of photos related to engineering archives, historical records, and family activities. Geotags can facilitate the location and identification of photos, bringing great convenience to the management and retrieval of these data. Without geotags, the actual locations of the features (buildings, streets, pipelines, etc.) represented by these photos cannot be determined, or an external database such as a database is needed to record and correlate their locations. Once these photos are separated from the database, their location information is lost.
Enriching geographical information: Geographical information is mostly composed of geometric figures and text attributes. Localized photos and other media can make GIS more intuitive, vivid and engaging.
Provide an important source of information for data mining: On today’s Internet, there are millions of photos with location that can be displayed on maps, and people can analyze a lot of valuable information from these photos.
geographical analysis #
Georesolution determines geographical location information for text or paragraphs in a document. A large amount of information on the Internet is related to geography. For example, every paragraph or even every sentence on a web page may refer to a place name or region. However, most of this geographical information is implicit, and no specific coordinates are defined in the text. Georesolution software, such as GeoSearch and Referencing Products (GSRP) provided by MetaCarta and GeoLocator, a location tool provided by Digital Reasoning, can perform georesolution, insert parsed geographical coordinates into original documents, or generate new structured document formats. For example, Chapter 4 introduced a GeoNames Web service that converts RSS to GeoRSS, and behind this conversion process is geoparsing.
Geographical resolution mainly includes two steps: place name recognition (also known as geospatial entity extraction) and geographical positioning (also known as geospatial entity interpretation).
Place name recognition processes natural language to determine place names in the text. This recognition is often not easy, such as “Pete is standing on the corner of Alabama Street and Washington Street, eating a Chicago hot dog.”
In this sentence, there are multiple nouns that may be place names, and geo-resolution software needs to be able to determine which noun is the real place name in which circumstances. For example,”Washington” has different meanings in different contexts: in Washington State, it is a local name; in George Washington, it is a person’s name; in The Washington Post, it is a newspaper name; in Washington Mutual, it is a bank. First name; is a street name in Washington Street.
There are often relative positions in the language, such as “50 miles east of Los Angeles”,”several states in the northwest United States”, etc. Parsing relative positions in similar statements can be even more challenging.
Geolocation is the conversion of recognized place names into coordinates. This step is mainly accomplished by matching addresses and place names, but it often encounters challenges. For example, querying the Official United States Place Names Database System (GNIS) can get more than 2000 place names that match Washington, and geographical resolution software needs to be able to determine the correct location in the text based on the context.
Georesolution converts documents into geospatial databases. It can organize a large number of documents by spatial location, draw them on a map, and conduct rapid spatial searches of the hidden information among them (Ridley, Grossed Frank, 2005). This is important for tasks like counterterrorism and espionage. These tasks require searching for information in a large number of web pages, emails, news, reports, speeches, and other document types. For example, analyzing a possible terrorist attack in a city requires geographical analysis of a lot of information about the city. Without an automated parsing process, staff would have to spend a lot of time reading these files and manually looking for direct and indirect information to determine the source, location and level of danger of the threat. This process must be completed as soon as possible so that effective measures can be taken to stop a terrorist attack before it occurs.
Due to the fuzziness of human language, geographical analysis is still a relatively challenging area. The research, development and future implementation of the Semantic Web will help make geographical resolution easier and more accurate.
location-based services #
Location based services ( LBS ) is one of the hottest topics in GIS applications at present. The popularity of mobile phones and tablets and the widespread popularity of mobile communications have contributed to the rapid development of LBS. LBS is introduced in Chapter 5 of this book. This section provides some supplements. There are mainly the following basic models of LBS (Baidu Encyclopedia, 2011).
Leisure and entertainment type: This type is mainly based on check-in mode. Representative examples include Foursquare With Gowalla, playing around and muttering, etc. Its basic characteristics are as follows.
Users need to proactively check-in to record their location;
Encourage users to sign in through honors such as points, medals and lords;
By cooperating with merchants, we provide discounts or discounts to users who receive specific points or medals, and it is also a marketing of the merchant’s brand;
By binding users with other social tools, users ‘geographical location information can be simultaneously shared.
Life service type: This type mainly focuses on surrounding life service search, including the following.
Group buying types: such as Groupon, Meituan and Lashou. com. Consumers, whether they know or don’t know, join forces to shop to get the best price from merchants. Based on the principle of small profits but quick turnover, merchants can offer group discounts lower than the retail price.
Coupon push services:Getyowza and mobiQpons provide users with location-based discount information push services. Their profit model is to share benefits through cooperation with offline merchants.
Service reviews: For example, Yelp and Dianping Network can provide coupons and promotional information from surrounding merchants based on the user’s location, and collect users ‘products, dishes, service attitudes, etc. toward the merchants and share this information with other users.
Social type: This type focuses on making friends based on location, communicating with users who are also nearby in the same geographical location to help them understand and get to know each other. Representatives are Foursquare, Yobongo, Neighbors and Doudouyou.
LBS has a huge market size and good profit prospects, and is very popular among venture capital companies. However, it should also be noted that there are some bubbles behind the craze in the field of LBS. As a direct-to-consumer service, accumulating user scale is a necessary condition for its ultimate success. At present, there are many LBS companies, and eventually some companies that cannot accumulate a large number of users will be eliminated.
LBS can not only provide targeted services, but also provide targeted services. For example, some laws or licensing regulations require certain products or services to be provided only in specific countries or regions, and are not allowed to exceed those regions. During the 2008 Beijing Summer Olympics, video broadcast rights in the United States were exclusive to NBC, and it was illegal for other companies to broadcast Olympic videos to the United States. China’s Sina.com and others complied with this regulation using LBS technology and refused to provide videos to Internet users from the United States (Figure 10.4). In this example, Sina.com determines the user’s location based on their IP address and determines whether it can provide video services to them. Fig. 118 China’s Sina.com complied with the copyright rule and refused to provide video of the 2008 Olympics to Internet users from the United States. (Thanks: Sina.com) # 
Online virtual reality #
Virtual reality (VR) is a technology that allows users to interact with a computer-simulated environment, which can be the real world or a virtual world. Virtual reality is related to the concept of telepresence, which immerses users in a simulated environment. The effectiveness of telepresence can be evaluated from two aspects (Steuer, 1993):
Reality: Including two indicators of perceived width and depth. The width of perception refers to the number of perceptual dimensions presented by virtual reality, for example, whether it only has visual effects or includes hearing, smell and touch. Perceived depth refers to the resolution of each perceptual channel, for example, visually it is 2. Whether it is 5-dimensional or 3-dimensional, how similar is the simulation effect of colors, features, etc.
Interaction: measures the degree of user influence on the content and form of a certain technical medium. The main indicators are the speed and scope of interaction.
Early virtual reality required high-end graphics cards and high-end computers. Today, most computers have the ability to run certain VR software. The VR file standard has also evolved from Virtual Reality Modeling Language (VRML) to Extensible 3D Language (X3D). Today, many VR applications can run smoothly in Web browsers and mobile clients, forming online virtual reality, such as
Online virtual earth: Like ArcGIS Explorer and GoogleEarth, they allow users to observe the surface of three-dimensional objects from different directions and heights. This can be said to be a relatively basic online virtual reality.
Users can enter a virtual environment with a three-dimensional interior: Users can not only observe the exterior of the virtual environment, but also enter and visit the interiors of three-dimensional buildings, pipes and houses (Figure 10.5).

Fig. 119 Allows you to browse three-dimensional virtual reality inside the building. (Thanks:B-Design 3D and Pictometry International) #
Online virtual world: A virtual world is a computer-simulated environment in which users can live and interact through their own avatars (the user’s graphical representation of themselves in the virtual world). Examples of online virtual worlds include Second Life, WOTld of Warcraft, etc. The virtual world usually simulates the geographical environment of an island or a city. Users or players can walk or fly in this environment. They can also choose a location to build and decorate their own virtual homes, shop in virtual shopping malls, play games, and chat with other users ‘avatars., make friends and live.
High-end dedicated virtual reality: These virtual realities simultaneously mobilize multiple senses, such as sight, hearing and touch. Users wear special glasses, helmets and gloves to achieve a more realistic immersion effect. For example, golf players must consider ground coverage, wind direction, wind speed and ground slope during VR activities, and experience the degree of their strength through the remote control with reaction force. Examples include flight, military training and multi-service real-combat exercise systems. Most high-end virtual realities are customized and not necessarily designed for online use.
Online virtual reality VR is closely related to 3D GIS, the Internet and other users on the Internet. The virtual geographical environment can be global, regional, or community level. The virtual geographical environment requires elevation data, ground image data, geographical element data and a three-dimensional model library. These data can be preprocessed in the server and downloaded to the client over the network. The World Wide Web not only transfers virtual reality software and data from servers to web clients, it is also a platform for users to build a virtual society and collaborate and interact. For example, hundreds of millions of users have registered for virtual worlds, where users can interact and have social relationships with other users, which is the most attractive aspect of the virtual world. Online virtual reality has huge application potential in the fields of sociology, psychology, business, marketing, entertainment, education and military.
Sensor networks and Internet of Things #
Sensor networks have multiple definitions. According to the OGC definition, a sensor network is a network composed of many sensors and the data they measure, which can be searched and accessed through the World Wide Web and application programming interfaces (Figure 10.6) (Botts et al., 2006). Another definition was proposed by the National Aeronautics and Space Administration (NASA) in 1997 (Delin, Jackson, and Some,1999): A sensor network is an environmental monitoring network composed of many sensors distributed in different places. These sensors can communicate directly through a wireless network. The information collected by one sensor can be shared by other sensors. The sensor network has self-reasoning capabilities, and can perform intelligent autonomous operations and perform automatic diagnosis and recovery.
Comparing the above two definitions, 0GC has a broader definition and includes many current sensor networks. For example, the U.S. Geological Survey’s National Water Information Query System has millions of sensor sites used to collect water flow, groundwater levels and water quality information. The U.S. Environmental Protection Agency’s Storage and Retrieval System (ST0RET) also has a large number of sensors for measuring water quality and other biological and physical data. Through project cooperation, the National Weather Service, the Federal Aviation Administration and the Department of Defense have established the Automated Surface Observing System (AS0S). The system is the main surface meteorological observation network in the United States. It can be used for weather forecasting and aviation operations, and can also meet the needs of meteorological, hydrological and climate research communities. Currently, the data of these sensor networks is provided through different interfaces and data formats. How to unify them is a problem that needs to be solved. Researchers from the Association for the Advancement of Hydrology of the University Alliance are studying how to use Web servers, toolboxes, standardized standards and procedures to more conveniently and in real time. Fig. 120 A broad sensor network, where people can find and access its data through Web access # 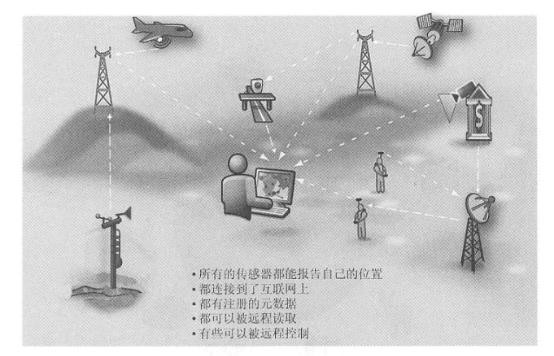
Observation data (Maidment et al., 2009,Ye and Djokic,2009)。
The current main research contents of OGC’s Sensor Web Enablement (SWE) include:① Using parameters such as location, observation values, and measurement quality to quickly identify the required sensors and their observation data;② Being able to obtain real-time and historical data of sensors in a standard format at any time, so that these data can be processed and positioned;③ Model programming sensors to increase their intelligence and meet specific needs; ④ Publishing, subscribing and receiving alerts and alerts issued by sensors.
NASA’s definition is narrower and refers specifically to intelligent sensor networks. This concept is related to the concept of the Internet of Things. The concept of the Internet of Things was first proposed by Kevin Ashton of the Massachusetts Institute of Technology in 1999. It is the “Internet connected to objects”. It equips sensors to power grids, roads, bridges, toll stations, buildings, water supply systems, dams, oil and gas pipelines, refrigerators, cars and other objects, and connects them to communicate with the existing Internet, especially mobile networks, realizing the integration of the online digital earth with human society and physical systems. On this basis, people can manage production and life in a more refined and dynamic way, thereby achieving a “smart” state (Figure 10. 7)。GIS technology provides a basic geographical information platform for the Internet of Things, helps the planning of the Internet of Things, such as the layout of sensors, and integrates all IoT objects onto a unified spatial platform, so that IoT objects can be intuitively, vividly and quickly positioned, tracked, searched, controlled, displayed and managed, interacted with IoT objects, can conduct spatial analysis based on the location and state of perceived objects, and can automatically respond according to changes in the environment or events, realizing an intelligent Internet of Things. Achieve smart planet, smart city, smart community and smart home. Fig. 121 Schematic diagram of the Internet of Things # 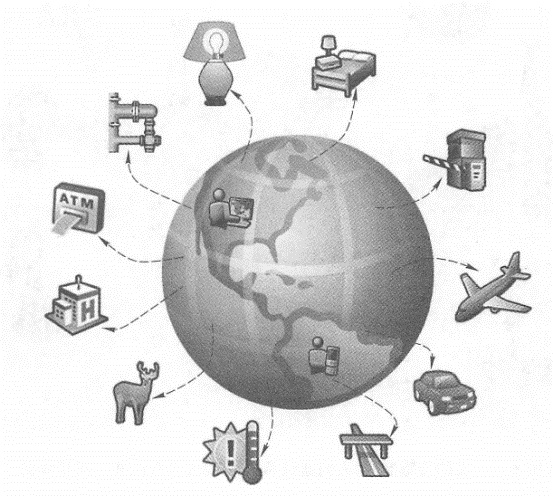
Cloud computing and cloud GIS #
At present, cloud computing technology is rapidly becoming a research hotspot and mainstream information technology in the scientific and technological community, as well as a product created by manufacturers. It has profoundly changed the model of information technology services and related applications, and has also had a significant impact on GIS.
(1)the concept of cloud computing
The definition of cloud computing is relatively vague, and there are different opinions. Based on definitions such as the National Institute of Standards and Technology, cloud computing is a model for the delivery and use of information technology resources that provides a convenient, on-demand, and configurable pool of computing resources.(For example, network bandwidth, servers, storage, applications, and services), which can be quickly scaled over the Internet based on usage needs without requiring excessive intervention from the tenant (Figure 10.8)(Mell and Gmnce, 2011; Tang Chuan, 2011).
Cloud computing has the following five basic characteristics.
On-demand self-service: Consumers can deploy resources themselves, such as servers and network storage, without the need for manual interaction with service providers.
Extensive network access: Cloud computing resources can be obtained through the Internet using a variety of clients such as desktops and tablets, as well as mobile phones.
Geographic-independent resource pools: Suppliers ‘resources are virtualized and shared pooled and can be rented by many users. Customers generally have no control or knowledge of the exact location of resources. These resources include storage, processors, memory, network bandwidth, and virtual computers.
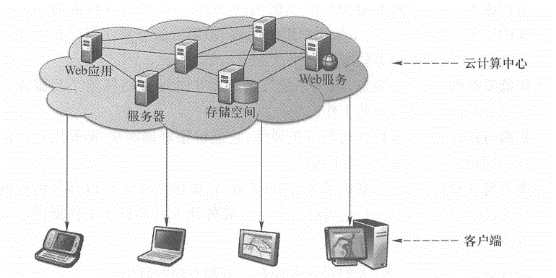
Fig. 122 Cloud computing provides a convenient, on-demand, and configurable location of computing resources, including network bandwidth, servers, storage, applications, etc. These resources can be called through the Internet and can be quickly scaled according to usage needs. #
Rapid scaling (also known as elasticity): To users, cloud computing resources often appear infinite, and the number of purchases can be increased and decreased at any time. The resources of the cloud center can be rapidly expanded and released to adapt to fluctuations in the number of users.
Service billing: Cloud computing systems can automatically monitor and control resource utilization for query by cloud computing providers and users so that they can charge and pay according to usage. A cloud may provide one or more models of services:
Software as a Service (SaaS): Provides applications to users in the form of websites and Web services, and users can use these services through Web browsers, mobile applications, and other clients. There are a wide range of examples in this category, such as the online mailbox provided by Google and others, and the customer relationship management system provided by salesforce.com.
Platform as a Service (PaaS): Provides application running environment, development interfaces and development tools, such as Google App Engine and Microsoft Windows Azure.
Infrastructure as aService (IaaS): Provides consumers with basic resources such as computing power, storage space and network bandwidth, such as Amazon’s Simple Storage Service (S3) and its Elastic Computing Cloud (EC2) and Apple’s iCloud.
(2)Advantages and disadvantages of cloud computing
Cloud computing can improve benefits and reduce costs, while at the same time bringing better flexibility and mobility (Kouyoumjian,2010), which is specifically reflected in the following four aspects.
Cost savings: Many cloud services are free or rented, and users don’t have to pay or just pay for the services they need. For most user organizations, renting cloud services is cheaper than purchasing, installing and maintaining those services locally.
Reduce complexity: Leasing cloud services shifts the responsibility for system installation and maintenance to the cloud service provider, alleviating these tasks.
Improve availability: Cloud computing has dynamic scalability, which can well solve the problem of fluctuations in the number of Web users and provide users with reliable services.
Enhanced mobility: Cloud computing inherits the advantages of the Web, providing services that can be accessed at will anywhere with a network connection, which provides great convenience for office employees and field workers in their daily work.
Cloud computing is still developing, and people mainly have the following two concerns about it:
The resources and functions currently provided are not complete: cloud computing providers determine which services to provide based on market demand, and may not be able to meet all needs of all users. Although the continuous and rapid development of cloud architecture in the future will provide more diverse resources and functions, it cannot completely solve the above problems. In some cases, users still need to resort to the software plus services (S + S) architecture (see Section 7.4 of this book).
Security and confidentiality: Similar to the answer to the question “Keep money safe in your own home or in your bank”, generally speaking, the services of cloud computing providers are relatively stable and much safer than the services provided by most companies themselves. If an organization has particularly confidential information and is unwilling to use a public cloud to host it, the organization can build its own private cloud on its own internal private network.
cloud GIS
Cloud GIS, also known as GeoCloud, is a GIS function provided through cloud computing technology. Think of it as a large computer center somewhere on the Internet that provides GIS capabilities to Web users. Similar to cloud computing, cloud GIS also has the above five basic characteristics and three service models. For example, Esri offers multiple forms of cloud GIS products, including
ArcGIS Server that can be deployed in the cloud: ESri provides a machine image (Amazon MI) of ArcGIS Server that is designed for installation in Amazon cloud computing environments. Users who purchase this product will receive a software license and within minutes they will receive ArcGIS Server software and some data storage space running in Amazon’s Elastic Computing Cloud. Users can also deploy ArcGIS Sever in a private cloud. Users have complete and flexible control over this platform and can upload their own GIS data to the server, publish their own geographical Web services, and create and deploy their own WebGIS applications. This product combines three models: PaaS, IaaS and SaaS.
ArcGIS Online (ArcGIS. com): This cloud GIS also combines PaaS, IaaS, and SaaS models (see Section 7.2).
Provide rich data and service resources: This includes a variety of basemaps, thematic maps and geoprocessing services provided by Esri (see Section 7.2), as well as a variety of data and maps contributed by many users and other types of Web services.
Users can upload and publish their own data and services to ArcGIS Online. These data can be CSV, TXT, GPX, shapefiles, data layers, layer packages (Layer Packages and Map Packages), etc.
Users do not need local GIS software, only need a Web browser to take advantage of this cloud platform. Users can upload these data files to the cloud and publish them into applications or services (Figure 10.9).
Users with ArcGIS desktops can publish their own databases, maps, tools, etc. directly to the ArcGIS.com cloud and share them with their own organization, partner organizations, or publicly share them with all users.
ArcGIS Online is also an application development platform. Users can create WebGIS applications without programming. Using ArcGIS.com, users can superimpose their own Web services and other Web services they query with the various basemaps provided by ArcGIS Online, and configure symbols, pop-up information windows, transparency for each layer, and more. Then, you can browse the dozens of application templates provided by ArcGIS.com, preview and select your own WebGIS application effects, and when satisfied, use this template to create your own WebGIS application.
ArcGIS Online is also an application hosting platform. Applications created by users can be deployed and hosted directly on ArcGIS.com, shared with their own organizations, partners, or made public to all users, who can use these WebGIS applications on desktop computers, mobile phones, and tablets.
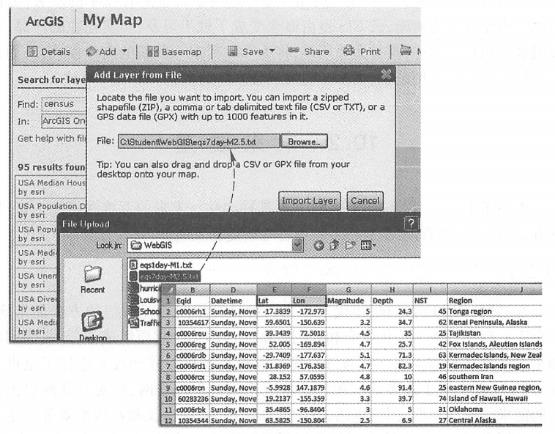
Fig. 123 ArcGISOnline provides cloud GIS services to upload data, create and host Web applications. (Acknowledgement: U.S. Geological Survey) #
Other cloud GIS applications: such as Esri’s Business Online Analytics (see Section 8. 2. Section 3) and Community Analyst Online (CAO). This is a SaaS model. Free users can see some simple charts of analysis results, and paying users can see more in-depth analysis reports. Users can pay by subscription methods such as the number of reports, monthly or annual.
People have some disputes about cloud computing and cloud GIS. As these disputes and the development of technology, the concept of cloud is changing from fuzzy to clear, and cloud GIS has also changed from a concept to a tangible and tangible product. Its development and application are accelerating day by day. This is the general trend, which will bring some new business models to GIS, further expand the application scope of GIS and bring new opportunities to the development of GIS.