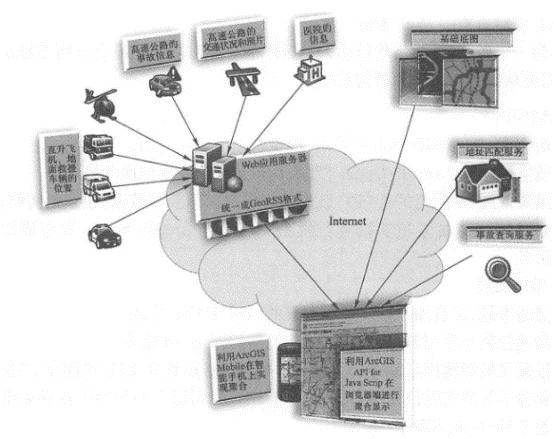
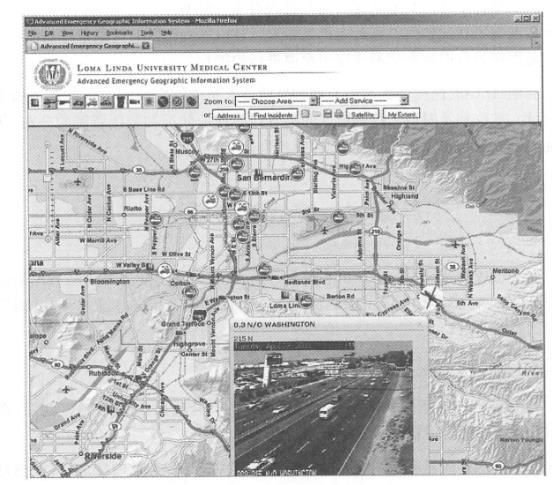
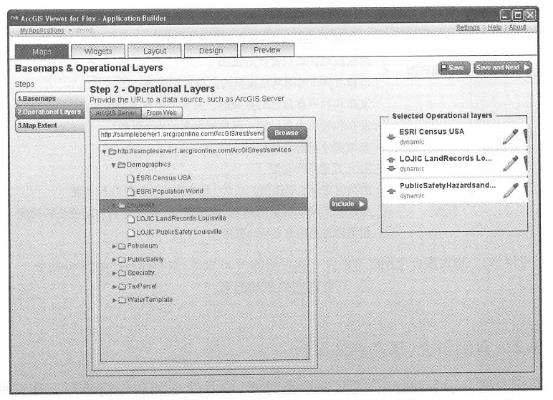
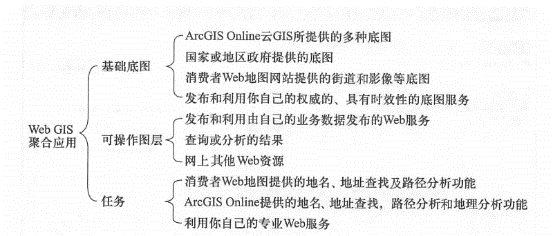
Nowadays, most WebGIS projects use aggregation methods, so learning how to aggregation will help master the universal methods of WebGIS application development. There are generally the following steps to build an aggregation application: ① Understand project requirements and clarify the goals to be accomplished. ② Conduct system design and list the Web resources required by the project according to the model of basic basemap, operable layers (i.e. business layers) and tasks. ③ Use geographic information portals (see Chapter 6) and Web search engines to find the Web resources you need. Evaluate the quality, availability, and programming interface of these resources based on project needs, and estimate the cost of these resources (some Web resources are charged) and the amount of work required to aggregate them. ④ If there are some resources you need that cannot be found on the Internet, you need to collect or purchase data yourself and publish services through your own WebGIS server or cloud GIS server. ③ Aggregation: According to project requirements, integrate these Web resources according to basic basemaps, business layers and tasks. Aggregation does not necessarily require programming, and in many cases can be achieved through configuration methods. Configuration (no programming required): Map browsers such as ArcGIS Flex browser, ArcGIS Silverlight browser, ArcGIS.com z? GIS’s map browser (see Chapter 7), ArcGISExplorer desktop and online versions, etc., can aggregate multiple resources without programming. You only need to modify some configuration files. For example, the ArcGIS Flex browser (see http://links.esri.com/flexviewer/for download methods and related documentation) can quickly build WebGIS applications and realize functions such as data display, graphic query and attribute query, online editing, data extraction, geocoding and printing. It is based on Flex widgets, and its interface and functionality can be manually modified by modifying XML configuration files or utilizing the ArcGIS Application Builder for Flex (Figure 4. 12)to automatically modify XML files for flexible configuration and composition. For another example, the map browser of ArcGIS Online Cloud GIS can aggregate Web services without programming, with mouse clicks, and provides Web map application templates and hosting capabilities (see Section 7. Section 3). Programming: If you have unique needs, you need to customize programming to achieve them. In most cases, you can consider modifying or expanding the map browser above, which can reduce development costs and speed up development. For example, source programs for both the ArcGIS Flex Map Browser and Silverlight Browser are available for free download. Both browsers are already well architected and easy to expand. The source programs for the Web map application templates provided by ArcGIS Online can also be downloaded, and you can improve on these programs. In a few cases, you may need to start from scratch and Fig. 51 Using the ArcGIS Flex application generator, users can select the services, widget functions, titles, icons, etc. they need to aggregate, and automatically create or modify XML configuration files, allowing users to create WebGIS aggregation applications without programming or directly modifying XML files. # Develop your own brand new application. As mentioned earlier, ArcGIS’s Java Script, Flex, and Silver-light interfaces are easy to use and are a good choice. Documentation related to them is available at httP://linkS.esri.com/javascript , links.esri.com/flex and www.example.com. http://links.esri.com/Silver-light ④ Testing, debugging and improvement. ④ Deployment and release. In recent years, advances in Web services and cloud computing (services provided by highly elastic computer centers on the network) have greatly increased the number of available Web resources. WebGIS projects generally do not need to create their own basemaps, because ArcGIS Online, Google, Microsoft, and surveying and mapping departments in many countries have released various and detailed basic basemaps. Of course, you will also find that some of the Web resources you need are often difficult to use directly or even do not exist on the Web. For the former, you need to pre-process Web resources, including data grabbing, format conversion, and geolocation; for the latter, you need to collect your own data and publish it as a Web service (Figure 4. 13)。Each institution has its own authoritative, up-to-date and sometimes critical thematic data or analytical models. For example, companies often have higher-precision underground pipeline data, distribution of important facilities, locations of private helicopters, customer addresses, and business analysis models. They can publish their data, maps, and analysis models as Web services, and if necessary, encrypt protection, and then use it to build aggregated applications that your business needs. Fig. 52 Building converged applications often involves finding available Web resources, publishing your own Web services, and integrating them # Aggregation is suitable for a variety of applications, especially situation awareness, emergency management and situation mapping. In these circumstances, the decision-making of the command center is life-related and requires racing against time. Commanders need to have accurate, comprehensive and timely information in order to make correct decisions quickly. Aggregation meets these requirements. It can dynamically combine information from many sources and comprehensively display it into a checklist. Because the aggregated source data remains in the hands of its owner, when the data source is updated, the aggregation can also be updated, ensuring the timeliness of the information. The Advanced Incident Response Service GIS(AEGIS) at Loma Linda University Medical Center (LLUMC) is a successful example of using aggregation for medical Incident Response Service. Medical emergencies are generally not as destructive and wide-ranging as earthquakes and tsunamis, but various disasters lead to medical incidents. Medical emergencies occur every day, and medical emergency systems operate every day. Therefore, this system has reference significance for other emergency responses. Project goals and requirements Loma Linda University Medical Center is located in the eastern part of the Los Angeles area of California. The area has a vast hinterland and a large number of residents. This area is also an area with high incidence of earthquakes and forest wildfires. As the largest hospital in the region, the medical center needs to deal with many medical-related emergencies such as car accidents, emergencies, violent crimes, earthquakes and fires. It needs an emergency command information system that can visualize real-time events in the region, and a GIS system that can display the location of emergencies, the distribution of emergency personnel and equipment, the area’s ground traffic conditions and air (especially in mountainous areas) meteorological conditions in real time. Assist the command center to make the fastest and best decisions, transport patients to the most suitable hospital in the fastest way, and save their lives (Fike, 2007; Kolbasuk McGee, 2008). Web resources required by the project As a medical institution, Loma Linda University Medical Center basically did not have any geographical information resources at that time and needed to obtain them from other departments and institutions. basic base map Street map: Obtained from ArcGIS Online for basic spatial referencing. Aerial images: Obtained from ArcGIS Online to better observe the ground environment. Important facilities: Obtain data from nearby county (county) government geographical information departments, including location information such as fire stations, police stations, airports, commercial buildings and schools. Published as a map service through ArcGIS Server. 可操作图层 Traffic accident: From the California Highway Patrol website,HTML format. High-speed highway speeds and photos: website format from the California Department of Transportation. Rescue aircraft and ground vehicles: including real-time locations of medical helicopters, police helicopters, fire trucks, ambulances and police cars, etc., from the SOAP-type Web service provided by Air-Tmk (Air-Trak, 2006). Hospital diversion status: Describe the status of each hospital’s emergency department, whether it is currently full, and whether it can accept new patients. The information comes from a Web service provided by the Southern California Hospital Association, in XML format. Weather: A NOAA-based weather service used for helicopter flight route selection. task Address matching: A Web service from ArcGIS Online that converts addresses reported by emergency calls into coordinates. Accident query: A REST Web service developed by this project. Others: This project is mainly about real-time situation integration, and there are not many functional requirements for analysis. Other analytical functions, such as calculating the best driving path based on real-time road congestion, calculating the atmospheric diffusion model and impact range of dangerous goods leaks, etc., can also be integrated if needed. system architecture Not all of the above-mentioned Web content and functions can be directly implemented using browser-side APIs. There is no formal programming interface for traffic accidents, traffic speed information, air ambulance helicopter location, etc. Information on ground vehicles and helicopters is a SOAP-based Web service that is difficult to use in the browser-side programming language; and hospital diversion status information does not have geographical coordinates. These content is preprocessed through techniques such as screen grabbing, address matching, projection conversion and format conversion to generate GeoRSS, an easy-to-use format. These preprocesses are complex, so this project put them on the server side and wrote a. NET technical program to do these processes. After that, the aggregation is completed on the browser side using ArcGIS’s Java ® Script API (Figure 4.14). polymerization The project was developed based on ArcIMS in 2005 and was upgraded to ArcGIS Server in 2008. Fig. 53 The AEGIS project at Loma Linda University Medical Center is a typical aggregation application. This figure shows the information sources it aggregates and its system architecture. (Acknowledges: Loma Linda University Medical Center and Tele Atlas North America, Inc.) # Taiwan, data processing is implemented using. NET programs on the server side, and the browser side uses the ArcGIS JavaScript interface for aggregation. A mobile version has been added to achieve aggregation on the smartphone platform using ArcGISMobile. Basemap aggregation: The ArcGIS JavaScript interface makes it easy to aggregate map services published by ArcGIS Server and map services from ArcGIS Online. Users can select maps such as streets and images. Aggregation of actionable layers: Most of them are preprocessed into GeoRSS format. This project uses AJAX technology to continuously read different data layers to the browser at a frequency of seconds to minutes, and then further parse the coordinates and attribute data of geographical elements from GeoRSS documents to display them. In order to facilitate non-geographical users in hospitals to understand this information, this system uses the graphics technology of the ArcGIS JavaScript interface and combines some intuitive and animated icons to clearly express the categories and states of these layers (Figure 4. 14)。For example, the direction of rotating propellers and icons is used to indicate the flight status and flight direction of the helicopter; different colors and icons are used to indicate whether the emergency room of the hospital is saturated and whether it can accept emergency patients (for example, yellow indicates that the hospital’s emergency services have reached its maximum load, prompting patients to be sent to other hospitals); green, yellow and red are used to show whether the speed of the highway is smooth or blocked. In order to facilitate quick information query, this system adopts the information window function of the ArcGIS JavaScriptAPI. Users only need to place the mouse on the icon they are interested in, and they can immediately get the status of the traffic accident, pictures of the highway, or types of surgeries that the hospital is competent for, etc.(Figure 4. 15)。Each type of data can be displayed or hidden separately, avoiding overcrowding of icons on the screen. Task aggregation: Use ArcGIS JavaScript to invoke server-side address matching and accident query functions. Fig. 54 The Emergency Medical Geographic Information System of Lomarinda University Medical Center uses technologies such as ArcGISServer’s Web services and JavaScriptAPI to aggregate a variety of Web resources related to emergency rescue, allowing the command center to comprehensively, accurately and in a timely manner understand the situation in the region. (To f: Loma Linda University Medical Center, Tele Atlas North America, Inc. and California Department of Transportation) # application Aggregation is a loosely coupled system, and special attention should be paid to the stability of its system in testing it. After passing testing and user signing for it, the system was deployed and put into operation. The value of AEGIS lies in the comprehensiveness and real-time nature of the information it generates through aggregation. The information contained in this system can be found in various information sources. For example, you can see traffic conditions on the transportation department’s website; helicopter conditions at the airport command center; and weather information on the weather website. But integrating these diverse information into a single map in a timely manner creates new value, revealing the spatial relationship between these layers, and the command center can intuitively solve practical problems in patient transportation, such as: Where are the sick and wounded? (It can be obtained through address matching, mobile phone reports from field personnel, traffic accidents, etc.) Where are the helicopters, ambulances and emergency vehicles? Which ones are closer to the incident site? Which hospital is closest to the patient, and can the hospital’s emergency room accept the patient? What is the traffic situation in the emergency annex? Is there a traffic jam? What is the current weather situation? Do helicopters have to fly over mountains? What are the meteorological conditions in mountainous areas? Should ground or air transportation be mobilized for rescue? Using AEGIS, the hospital’s dispatch center and field rescue personnel can view local events on a map, and comprehensively, accurately and promptly understand the status of emergencies and the distribution of rescue resources in the area, so that they can quickly formulate optimized rescue plans and save lives.Steps to build aggregation #
Case study: situational awareness aggregation #