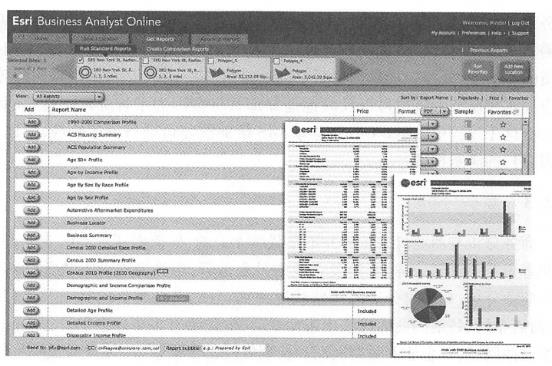
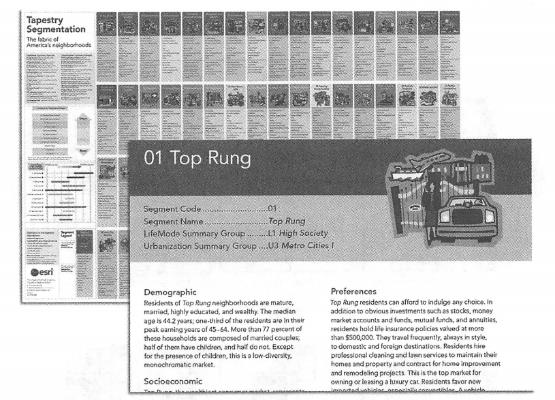
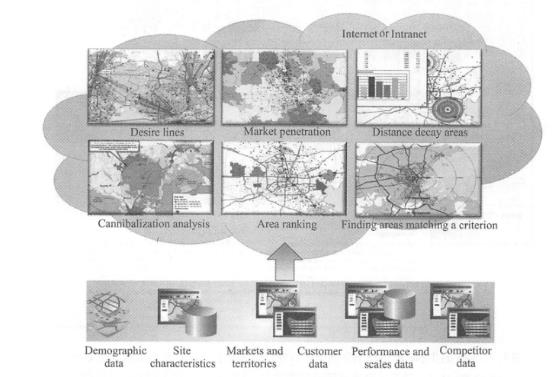
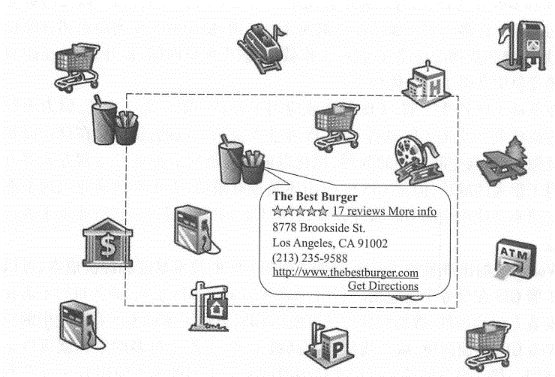
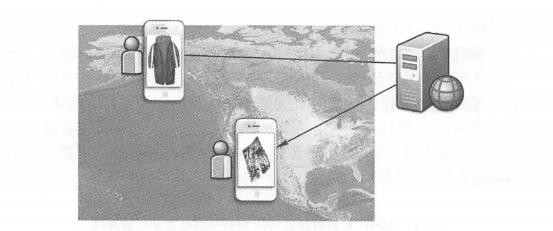
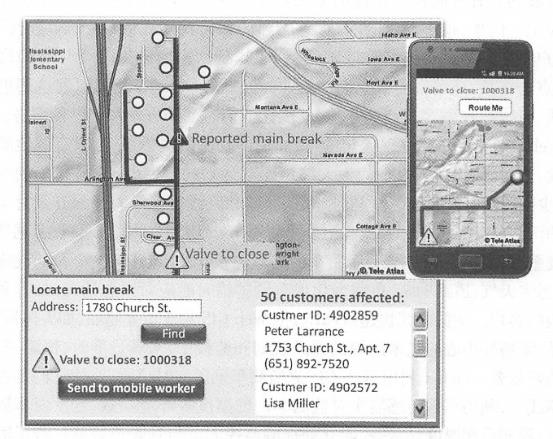
Business organizations that use GIS often regard how they use GIS and the benefits it produces as a trade secret and are unwilling to disclose them. The details of their use of GIS are rarely seen in the newspapers. However, business organizations that use GIS have increased significantly in recent years. This section focuses on several major application types, such as online advertising, business operations, and business analytics. In the Internet age, geographical location is particularly important for online advertising and marketing. For products that can be downloaded online (such as software), the geographical location of buyers and sellers is not important, but most goods and services involve door-to-door purchases or services. For example, when people go to restaurants, stay in hotels, or hire plumbers to their homes to repair water pipes, the geographical location and distance between buyers and sellers become important considerations when choosing a business or buyer. Search portals and their Web maps rely on advertising for profits and are an important type of advertising company today. To support location-based online advertising, advertising companies usually first determine the location that network users expect to query, and then send advertising content for that location. To support geolocation, advertising companies need at least two types of geographical data: the location of points of interest and the range of users ‘expected queries (Figure 8.1). Fig. 96 Location-based advertising is actually a geographical query, that is, within the user-specified or implicit geographical range, which types of business users are more interested in. In this figure, points of interest include banks, gas stations, shops, automated teller machines (ATMs) and entertainment attractions. The user’s query scope is shown by the dotted line # Point of interest (P0I): The location of a P0I refers to the place where users may be interested, and users often go there to buy products or services. For example, shops, banks, auto repair shops, movie theaters, parking lots, hotels, gas stations, houses for sale, and tourist attractions are more commonly used points of interest (Figure 8.1). Information on points of interest usually includes their names, product or business types, relevant descriptive information, telephone numbers, street addresses and geographical coordinates. Other information such as user ratings, pictures and website links is also very useful. Advertising companies can collect information on points of interest through a variety of methods, such as sending employees with GPS receivers to collect on site, geocode the street addresses of merchants in phone books, and reading and geocode addresses listed on merchants ‘websites. Scope of user expectations: Users can enter the location they want to inquire, such as looking for hotels in a certain city. When users do not enter their desired location, they often refer to the vicinity of their current location, and nearby businesses may be those they prefer to inquire about. For example, when a user queries restaurants, it is often within a range that the user can quickly reach by walking or driving. Advertising companies can determine the user’s current location through various methods (see Table 8. 1), and provide location-based information services based on this location (see Chapter 5), such as POIs such as restaurants around the user. 表8.1在线广告公司获取Web用户地理位置的主要方法 Method of determining location advantages disadvantages User loses person accurate Users are required to input Mobile positioning (satellite, mobile base station, or Wi-Fi methods) You don’t have to ask the user and automatically obtain the user’s location. The GPS method has high accuracy and can reach the meter level. The error of mobile base station and Wi-Fi methods is slightly larger (but both can meet the needs of location-based advertising) The GPS method can only be used on mobile phones or tablets with built-in GPS receivers and may be blocked by buildings or terrain around the user’s location. IP address location Automatically obtain user location without having to ask the user The spatial accuracy is not high (generally to the city level, but can satisfy many applications); in rare cases, errors occur, such as users using a proxy server Based on user registration information Users provide geographical information when registering for certain social networking site accounts or free emails Users need to register; some users are reluctant to provide real location information With the user’s location, advertising can be more precise and can provide targeted content based on the geographical location of website visitors. This is called “GeoTargeting.” This is a location-based service. For example, an advertising website can provide a Web user from cold Alaska with an advertisement for cotton-padded clothes around him, and provide a Web user from the warm coast of Southern California with an advertisement for swimsuits. This can better meet the user’s needs and make the user more likely to purchase it (Figure 8.2). Accurate location-based advertising does not necessarily require electronic maps, and people’s keyword (word) queries on search engines often imply geographical location. Some researchers have explored ways to determine location from user queries. Discovering Users ‘Specific Geo Intent in Web Search/i ( Yi, Raghavan,and Leggetter,2009) found that 13% of Internet queries contained some degree of geographical information, and half of them had geographical query conditions that users explicitly entered.(84% of them are city-level queries), while the other half imply geographical query conditions. For example, users who order pizza or look for a coffee shop often need to find the pizzeria or coffee shop in their city or community. Search engines can use the aforementioned method to determine the query conditions that imply geographical location in this case. Fig. 97 By understanding the user’s current geographical location or the geographical locations that users are interested in, advertising websites can provide more accurate advertisements based on users ‘needs. (Thanks: National Park Service) # Google’s and Microsoft’s search engines and Web maps are typical examples of location-based targeted advertising. There are many other advertising websites that target individual industries. For example, Zillcm is an advertisement focusing on real estate. It provides information about every house in most parts of the United States, such as area, number of toilets, homestead area, estimated price, campus, price curve over the years, annual property tax amount, bidding prices for houses for sale, and transaction prices for houses sold. Zillow’s main revenue is advertising, such as advertising for real estate agents, banks and mortgage companies. Online advertising websites have the following characteristics: Free for Web users (i.e., advertising audiences); Charging companies (i.e. advertisers) that place advertisements; Have a large amount of information on points of interest to attract a large number of Web users, generate enough traffic, and attract advertisers; Pay attention to the user experience of the website and make it fast, convenient and attractive. Fig. 98 In the online advertising business model, advertising websites charge advertisers and free it to Web users (i.e., advertising audiences) # Daily business operations involve many activities, including customer relationship management (CRM) and enterprise resource planning (ERP). Customer relationship management uses modern information technology to manage customer relationships to maintain old customers, win new customers and improve corporate profits. It involves a variety of pre-sales and after-sales services. Customer service is an important part of customer relationship management. Good customer service requires quick and timely obtaining customer problem information and customer historical problem records, so as to solve customer problems in a targeted and efficient manner, improve customer satisfaction, and enhance corporate image. Enterprise resource planning, or enterprise resource planning, is based on information technology and provides decision-making and operation support for enterprise decision-makers and employees with systematic management ideas. It can be used not only for enterprise decision-making management, but also to support the daily operations of the enterprise. Enterprise resource planning and customer relationship management are closely related, but the two are different. Customer relationship management focuses more on export-oriented issues, such as marketing and services and other external resources related to the market and customers, emphasizing the rational use of high-quality services to develop and maintain customers, and optimizing customer-facing processes to reduce the cost of acquiring new customers and retaining old customers; Enterprise resource planning focuses more on internal management of the enterprise, focusing on corporate resources such as production, inventory, quality and cost, and optimizing internal management processes. GIS is gradually integrated with CRM and ERP, and the degree of integration is deepening, from the initial simple drawing to a close connection with two-way operation functions. WebGIS has many applications in customer relationship management. For example, many store websites have functions such as “How to find us” and “Branch Find”. Users can enter the name or zip code of a city and find a list and map of the store or multiple branches. Click on the link and get their business hours, contact numbers and driving directions on how to get there. In this way, customers can feel convenient and considerate service before they come to the store. WebGIS helps establish a modern and intelligent logistics and distribution system, which can effectively simplify circulation procedures, save circulation time and costs, greatly shorten the preparation time of vehicle allocation plans, improve vehicle utilization, reduce idle and waiting times, and rationally arrange distribution areas and routes, etc. Werner International Logistics Co., Ltd., one of the top five freight companies in the United States, uses WebGIS to track the operation and services of its more than 9000 trucks. It displays the specific locations of trucks, maintenance points and Werner’s facilities on a Web map; it can respond to emergencies and estimate and notify affected customers in case of severe weather, road interruptions, load changes, or vehicle breakdowns. FedEx uses WebGIS for the delivery planning and monitoring of important items, such as human organs, dangerous items, art requiring extra care, etc., to meet punctuality, constant temperature, safety and other special needs. FedEx uses WebGIS to monitor the real-time position of vehicles and monitor whether they are on the planned route. It uses on-board sensors to monitor environmental parameters such as temperature inside the vehicle in real time. If vehicles deviate from the route, travel delays, or temperature abnormalities are found, it can immediately remind the monitoring personnel to contact the driver. If the vehicle fails, you can find the nearest repair location and redesign the route. Geofencing technology can generate a reminder service when a person, vehicle or other item enters or leaves a certain distance around a certain place. For example, through mobile phone monitoring, when children leave a certain range, their parents are automatically notified; Through ankle rings, criminals on parole are monitored and public security personnel are automatically alerted when they leave a certain range or enter the vicinity of the school. FedEx uses geo-fencing technology to automatically alert customers when goods approach their destination. This modern logistics and transportation system helps FedEx maintain a high level of user satisfaction. Pidpa is the largest supplier of public drinking water and water facilities in Flanders, Belgium, using information technologies such as GIS, ERP, Data Acquisition and Monitoring (SCADA), Laboratory Information Management System (LIMS) to manage and monitor wells in its service areas. Water allocation may seem simple, but it requires maintaining high vigilance and strict quality standards. The company’s laboratory tests the water quality of the water supply network every day. Once there is a problem with the water quality of a certain pipe network, it must be closed immediately and the affected users change the water source. How to collect, maintain and use relevant information to manage water allocation, quality monitoring and after-sales services to ensure sufficient water resources is a complex task. The company has adopted ERP software to help achieve its strategic plans and operations. The company has developed an intranet based WebGIS that integrates GIS with SAP(systems applications and products in data processing), SCADA and IT systems. Its original function was for map editing, and then every user in the company could use this browser to view and read geographical information. Depending on the task, this GIS application can provide different types of information, such as overviews of production centers, water towers and pumping stations that provide water to workers repairing water pipes. Through WebGIS, general staff of the company can use GIS for customer service and resource management without the need for GIS technical experts. As shown in Figure 8.4, when the company receives a complaint or report from a customer that a water pipe leaks or bursts, the customer Fig. 99 In this schematic diagram,WebGIS is used to help water companies quickly identify the specific location of pipe breaks, identify the valves that need to be closed, send this information to the mobile phones of field personnel, and also list the users who will be affected so that they can be notified. (Thanks:TeleAtlas North America, Inc.) # The operator in the service center can use the Web map provided by the company to determine the location of the pipe damage, calculate the valves that need to be closed and the families affected by it. On the one hand, he can send this maintenance information to the mobile phones of field personnel. Field personnel can use the mobile phone map and this information to troubleshoot problems as soon as possible; on the other hand, customer service personnel can also promptly notify customers who will be affected by water pipe repairs. In this process, WebGIS and mobile GIS help the company respond quickly, which can greatly improve customer satisfaction. Business analysis is not completely unrelated to daily business operations. Like the enterprise resource planning and customer relationship management mentioned earlier, they involve both the daily operations of the enterprise and the decision-making of the enterprise. This section focuses on business analysis, such as evaluating the operating status of retail branches, analyzing the characteristics of potential customers and their distribution areas, store layout, what products stores in various places should sell, how much inventory they need, etc. Correctly analyzing and answering these questions is crucial to the short-term profits and long-term development of the company. Most of these issues involve geographical elements and can benefit from GIS technology. Effective business analysis requires the synthesis of multiple data, not only of the company’s own data, but also other data. For example, information about the company’s own products, stores and customers; demographic information, such as detailed structural divisions of the population, age, race, education level, gender, household income, etc. in each county, city, district and even community, and future population growth trends; Consumption information, such as household expenditures and consumption habits in each region, product categories purchased and the consumption quantity of each category, and demand potential for various types of goods; Location information of commercial outlets, such as shopping centers, public attractions and competitor stores. Collecting, managing and analyzing this data on their own is difficult and expensive for commercial companies, especially for small businesses. However, with the advent of cloud GIS, including the SaaS business model, obtaining these functions has become increasingly cheaper and more convenient. Enterprises can purchase the data and analysis functions provided by cloud GIS according to their needs and pay according to actual usage. This model is very attractive and can eliminate or reduce the complexity of system development and reduce the cost of data collection and maintenance (KoUycmjian, 2010). Esri’s Business Analyst Online (BAO) is an example of providing business analysis capabilities through SaaS and cloud computing models. BAO is built on ArcGIS Online cloud technology and integrates GIS technology with a large amount of business data such as demographics and consumer expenditures. It has tens of thousands of indicators and can generate numerous reports and maps according to user needs (Figure 8. 5)。The method of use is simple. Users can select a certain location on the map to obtain these business reports of their neighboring areas, such as the expected population size and composition of this year and the next five years, the characteristics of shopping centers and retail markets in the area, the traffic volume and its changing pattern at major intersections (in the United States, cars are the main mode of public travel, and the more traffic volume, the more potential customers), automobiles, finance, housing, medical care, beauty, entertainment, Consumer spending and market potential reports in industries such as electronics and catering, etc.(Figure 8. 6)。 Fig. 100 Esri Business Online Analytics provides a variety of business analysis reports as a software-as-a-service approach # Fig. 101 Esri’s Business Online Analytics can provide business analysis reports and maps with tens of thousands of variable indicators based on the location or region specified by the user: (A) The range of the region specified by the user, and the numbers on the map represent the market segment categories of each community;(B) are the names and characteristics of some market segments;(C) Displays information such as the number of merchants, market demand, supply, supply gap or excess in the food, automobile, furniture and other industries in the area selected by the user. (Thanks to:Tele Atlas North America,Inc., US Census Bureau and US Bureau of Labor Statistics) # Market segmentation divides the overall market of a certain product into several consumer groups based on differences in consumers ‘abilities, needs, purchasing behaviors and purchasing habits. Each consumer group is a market segment, and each market segment is composed of similar consumer groups. It was proposed by American market scientist Wendell R.Smith in the mid-1950s. Through market segmentation, companies can analyze and compare the customer characteristics, purchasing potential, satisfaction and competition conditions of these market segments, identify market opportunities that are beneficial to the company, and enable the company to make timely decisions to put into production and sell in other places, or prepare new product development plans based on the company’s production technical conditions, make necessary product technology reserves, seize the initiative to upgrade products, and open up new markets to better adapt to market needs (Baidu Encyclopedia, 2011)。The results of market segmentation often need to be implemented in geographical locations, that is, where the market segment the company is targeting is. In this way, the results of market segmentation can be more targeted. BAO provides market segments and geographical distribution in the United States. Esri’s Tapestry Market Segment divides U.S. communities into 65 market segments based on demographic and socioeconomic characteristics, describing each market’s spending power, consumer needs, lifestyle and life stages (Figure 8.7), and providing maps showing the geographical locations of these market segments (Figure 8. 6)。Users can log in to BAO’s website to directly use BAO’s data and functions. BAO also provides Web services and browser-side programming interfaces for enterprises to conduct secondary development to achieve their unique business needs. Users can also upload their own data to BAO for comprehensive analysis and display with the data provided by BAO. Fig. 102 Esri’s Tapestry Market Segment divides U.S. communities into 65 market segments based on demographic and socioeconomic characteristics, describing each market’s spending power, consumer needs, lifestyle and life stages # Online business analysis products like BA0 can help companies conduct multiple analyses, such as conducting trade zones on existing stores (tradearea) analysis, which analyzes the store’s performance and potential based on market data in the region, such as where the most valuable customers to the company are located, whether there are already competing stores there, whether the market is saturated or still has a demand gap, what is the potential to open a new store here, where to open it to cover as many customers as possible, what characteristics and preferences customers have, what media they need to advertise through, where to advertise, How to position advertising (such as price concessions or quality and taste), so as to help companies select target markets in various places, so as to concentrate manpower and material resources to enter the target market and formulate special and targeted products and marketing strategies. BAO inherits the advantages of the SaaS model and adopts report charging, monthly or annual ordering, or report number charging, and can use GIS analysis functions for tens to hundreds of dollars, so it can penetrate into large, medium and small enterprises. For example,Levis a world-renowned clothing company known for its production of jeans. The company receives a large number of retail franchise applications every week, and therefore needs a standardized and evidence-based solution to approve these applications. Levis uses BAO to display the location relationship between these new stores and existing stores on a map. If the new store is located too close to the existing stores, the application cannot be approved. Levis can further evaluate the business potential of a candidate location based on demographic data, consumption habits and levels within the 1-, 3-and 5-mile area and decide whether to accept the application (Levi Strauss & Co., 2007). Fig. 103 The ArcGIS business analysis server contains a large amount of business data and a series of business analysis functions. Enterprises can integrate their own business data to build business analysis applications with specific functions, providing decision-making basis for enterprise management. (Acknowledgements:Tele Atlas North America,Inc. and U.S. Census Bureau) # Some companies need special functions for business analysis or are unwilling to upload their data to the cloud. They can use things such as ArcGIS Business AnalystServer (BA Server for short) to develop their own business WebGIS applications. BAServer contains a database of basic basemap data, demographic data, customer consumption data and market potential data. These data can be combined with the user’s own database to support a series of mapping, statistical and analysis functions, such as competition analysis and location assessment, Desiline (i.e., the connection from each customer’s address to branches in the area), business district analysis, principal component analysis of customer characteristics, etc.(Figure 8. 8)。Using products like BA Server, business organizations can build “if-what” models. For example, how to respond to natural or man-made disasters or supply chain interruptions, calculate the vulnerability of each store, etc., to formulate plans for the sustainable development of the business. The analysis results can be presented in the form of maps or report templates. Through WebGIS and corresponding information security controls, it provides a decision support information platform for management at all levels of the enterprise.Accurate location-based online advertising #

commercial operation #
business analysis #